Leaderboard


Popular Content
Showing content with the highest reputation since 07/29/25 in Posts
-
As I do at the end of each year, I’ve broken down the Steady Options 2025 trade performance by trade type. Numbers were taken directly from the data in the Performance screen (plus some recently closed trades). Here’s are this year’s stats along with some comments from my perspective. Where applicable, I added totals from prior years for comparison. Unfortunately, 2025 was Steady Options worst performing year. I’ll try to present what I believe to be the main reasons for this as they apply to each type of trade. From an overall perspective, here are some key points that I believe factored into the performance: Most SO trades are Vega positive trades leading up to earnings events, so volatility plays a key role in the outcome of our trades. Volatility rising helps trades and volatility declining hurts trades. 2025 saw 4 VIX spikes that occurred rather quickly (not a gradual rise), most spikes were relatively short in duration with declines starting shortly after the spikes. When you look at the year in total, the vast majority of the time we were in time periods where volatility was falling. Trades that were in place prior to the spike performed well, but other trades that did not encompass a spike commonly dealt with falling volatility and RV declines bigger than prior earnings cycles. This meant that trade that would have been small to moderate gains in prior years turned into small to moderate losses this year. Losses above 10% were also more common. There were some things that worked very well this year, although they were in some of the portfolios outside of SO. Steady Yields (SY) and Simple Spreads (SS) performed very well as many of their trades were helped by the same things that hurt the SO trades. Most trades in SY and SS tended to be Vega negative, meaning that they were helped by declining IV – so both time decay and declining IV helped these trades. Pre-Earnings Calendars 24 Trades – 21 win, 3 loss (88% win) – Average Gain +8.77% 2024: 65 trades (81% win) – Average Gain +12.13% 2023: 65 trades (85% win) – Average Gain +9.56% 2022: 11 trades (64% win) – Average Loss -9.55% 2021: 110 trades (79% win) – Average Gain +12.82% 2020: 33 trades (85% win) – Average Gain +21.97% 2019: 54 trades (65% win) – Average Gain +9.27% 2018: 40 trades (78% win) – Average Gain +9.61% 2017: 31 trades (84% win) – Average Gain +13.81% 2016: 44 trades (80% win) - Average Gain +15.07% 2015: 51 trades (80% win) – Average Gain +12.67% 2014: 48 trades (71% win) – Average Gain +13.80% 2013: 24 trades (88% win) – Average Gain +20.60% Comments: Overall winning percentage was at the high end compared to prior years, but average gain per trade was at the lower end. This year lacked some larger gains that we got in prior years (likely due to volatility declines). Number of trades was much lower than most prior years as this year saw the calendars for many stocks having their calendar RV significantly higher than prior cycles, and therefore trades were not opened in these cases. There was a learning here to take forward into next year. For calendar trades entry we look to enter at lower RV levels and/or on stocks that show a pattern of rising calendar RV heading into T-0. Many stocks show a tendency for calendar RV to rise regardless of current levels, but we didn’t open trades on these stocks if the current RV was elevated. While we wouldn’t want to enter if calendar RV was sky high, hindsight showed that opening trades when RV was slightly to moderately elevated wound up being winners. Earnings calendars continue to be a core SO strategy. Straddles/Strangles 42 Trades - 21 win, 20 loss, 1 break-even (51% win) – Average Loss -0.56% Breaking down further by hedged and non-hedged: Non-Hedged – 21 win, 17 loss, 1 break-even (55% win), average gain +0.24% Hedged – 0 win, 3 loss (0% win), average loss -10.97% 2024: 57 trades (73% win) – Average Gain +4.72% 2023: 166 trades (64% win) – Average Gain +1.65% 2022: 148 trades (71% win) – Average Gain +4.89% 2021: 129 trades (68% win) – Average Gain +3.27% 2020: 118 trades (67% win) – Average Gain +2.80% 2019: 106 trades (68% win) – Average Gain +3.58% 2018: 72 trades (83% win) – Average Gain +5.40% 2017: 77 trades (79% win) – Average Gain +5.02% 2016: 18 trades (72% win) – Average Gain +5.19% 2015: 44 trades (68% win) – Average Gain +2.61% 2014: 74 trades (62% win) – Average Gain +2.54% 2013: 104 trades (57% win) – Average Gain +1.35% Comments: Lower number of straddle/strangle trades compared to prior years, due primarily to double diagonal (DD) trades which have similar gain targets to straddles and strangles but can be kept open longer. Overall winning percentage and average gain per trade were at lows. This is primarily due to the decline volatility which saw straddle RV dropping by larger percentage compared to cycles in prior years. When the stock price did moves, gains were often muted when factoring in the larger RV declines. From a downside risk perspective, we saw more losses above 10% compared to prior years with 7 of the 20 losing trades having a loss greater than 10%. 12% of trades hit 10% gain target, which is lower compared to prior years. These trades remain low risk trades as it takes RV dropping much more than their prior cycle tendencies to be significant losers – unfortunately we saw more cases of the outsized RV drops this year. Double Diagonals DD trades have the goal of having performance similar to straddles/strangles – but have the ability for the trades to be open for much longer periods of time (up to 3 weeks prior to earnings) giving the stock more time to move but still have minimal downside risk. 48 Trades - 28 win, 19 loss (60% win) – Average Gain +0.79% 2024: 52 trades (73% win) – Average Gain +4.86% Comments: Winning percentage was down from last year and average gain per trade was only slightly positive. Again, a result of RV declines more than prior years. What were small winners last year because small losers this year. Last year, all losing trades were under 10% losses (majority of losses were under 5%). This year we saw 6 losses above 10%, but all losses were under 20%. The DD trade is a low risk trade type with minimal downside risk, but this year has shown that when RV declines are more than expected then losses in the 10%-15% range can occur if the stock price doesn’t move. 25% of trades hit 10% gain target (compared to 35% last year). This is not a huge difference, it means that when the stock price moves you can hit that 10% gain target regardless of what happens with RV. Pre-earnings Iron Condors In the 4th quarter we introduced the pre-earnings Iron Condor (IC) trade as a way to get a Vega negative trade type into the SO mix of trades. We targeted stocks that have a consistent and large straddle RV decline heading into earnings whose historical straddle performance show mostly losing trades (meaning the stock price doesn’t tend to move a lot prior to earnings). 10 Trades - 7 win, 3 loss (60% win) – Average Gain +0.07% Comments: Large percentage of winning trades, but one of the three losing trades was an oversized loss when stock price made a big move corresponding to a larger market downturn. Will continue with these trades in the future, trying to limit those bigger losing trades by keeping risk vs reward near equal and by selecting stocks whose straddle RV decline is both large/consistent and happens in a relatively short period of time. Other Trades Non-Earnings RICs: 2 win, 1 loss (67% win) – Average Gain +0.00%. These non-earnings trades have higher downside risk if stock price doesn’t move. In this case the 1 loss equaled the 2 wins. Hedged ratios and BWBs: 2 win, 3 loss (40% win) – Average Loss -10.90%. These were hedged directional trades, the losses were larger when the stock price didn’t move in the right direction. S&P500 addition date trade: 1 win, 2 loss (33% win) – Average Loss -14.50%. These trades play for stock price decline (or at least staying flat) after the S&P500 addition. The pattern of prior year additions was broken this year. Several of the additions this year had much less lead time compared to prior years, so this might be a factor. Summary 2025 was a very challenging year for the Steady Options model portfolio. We used the same types of trade setups and analysis that has worked for us year after year. However, the market behavior this year yielded underperforming trade results. Going forward, we will continue to try to optimize trades and limit losses – but one underperforming year does not mean we need to re-think every type of trade as they have performed consistently well in prior years As always, I’d like to highlight and thank the SO community. We continue to have a group of very smart people that seems to grow each year who share their ideas and knowledge – this is what makes SO great. Looking forward to a better 2026.17 points
-
As all our American friends are recovering from their dinners and drinks, a bit of light humour on this Monday. A friend of mine knew I was an active trader and asked whether I could share my portfolio with him and we could then discuss it. To be fair to him, he was a complete newbie and I restricted myself to sharing my shares portfolio explaining that the options bit is perhaps a bit complicated. The idea was that we would talk about it and how to build a balanced portfolio, again credit to him he took it seriously and researched the companies in my portfolio perhaps further than even I had. He therefore came prepared with his homework for our discussion this weekend and proudly laid out what he found, prefacing it with: "I researched all the companies in your portfolio, there is just one I had an issue with: ALPHABET, I googled it but can't find out which company it is."10 points
-
In the name of full transparency, I would like to address some issues regarding SteadyOptions recent performance. I will separate the analysis into several separate posts. Our performance in the recent months is not in line with our long term returns, as everyone can see on the performance page. The main reasons for the recent underperformance: We are struggling with a change in the fundamental behavior of volatility at the moment. Our trades rely on RV and therefore also IV and this has not been acting as expected. Periods of extended VIX decline have always been some of our worst performers. The main problem now is that we have been in a long period of VIX decline that’s been going for months - there have been a few spikes but in general VIX has gone from 30+ to the 20’s to the mid teens (and making things worse is many periods of minimal stock price movement during this timeframe). Our core trades do well when volatility is stable or rises. When volatility started to drop, it created some large percentage losers on a few trades that had an oversized negative impact on the portfolio performance. We had much less trades in 2025, which made the impact of those larger losses bigger. We had less trades because some options became very expensive, so it became difficult for many trades to fit into a $1K allocation, and for many stocks with moderate liquidity in normal times, now had less liquidity and very wide bid/ask spreads. This made them much more risky to use for options trades as slippage was a big concern. We used some directional trades, and the stocks did not follow historical patterns in those trades. When a directional trade goes against you, losses can grow very quickly. This is what happened with TTD, XYZ, KO, FL etc. Some of the non directional trades also experienced outsized losses. We will reduce the number of directional trades going forward. We used less calendars than usual because many of them were way too expensive compared to previous cycles. Now with VIX in the mid teens, we expect to trade more calendars, which is one of our best performing strategies. We are having extensive internal discussions on how to adapt to the current environment. Our strategies are designed to make money in any market. They are not guaranteed to make money, but our long term objectives are still in place. No strategy works all the time. There’s no room for ‘never’ or ‘always’ in the financial markets.8 points
-
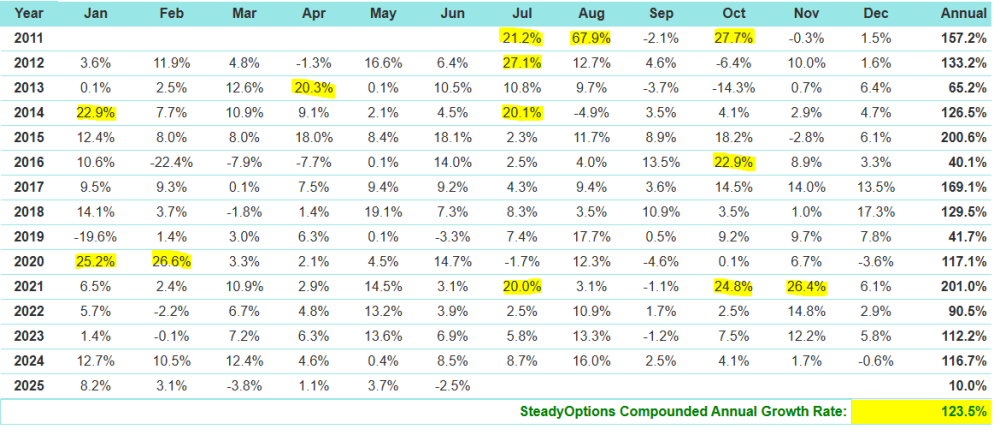
Steady VIX 2025 Strategy Performance vs. SPY The Steady VIX 2025 strategy outperformed SPY in 2025 after closing out today’s trades. Performance Comparison: • SPY returned approximately 17.x% as of its latest level around 683. • Steady VIX 2025 finished with 20.4% total returns after including today’s closed trades. This outperformance is particularly noteworthy given that 2025 featured multiple significant VIX spikes — most notably during the April volatility surge that many market participants will remember for years. Despite these periods of elevated uncertainty, the strategy was often only half-allocated, yet still managed to outperform SPY. Trades like those executed in the Steady VIX 2025 strategy — in addition to a regular long-only portfolio — materially boosted overall returns. Also I wanted to mention, Allocation wise, we didn't over allocate, didn't take risky positions as much as possible. HALF allocation most of the time was highly conservative from our side. If someone had 1-2% better entry price as limit to enter the trade, I think most of the time there was BETTER PRICING for all the trades that we entered. So I won't be surprised folks getting 25% returns on SteadyVIX as well.6 points
-
I just received this email addressing some issues SO was facing in the past. I’m not a member anymore but I was and I’m familiar with the strategies. I’m a vol trader since over 20 years so here my 5 cents. There is no fundamental change in volatility. Volatility is behaving as it always does. Volatility reflects the future expectation of movement of an underlying during a certain time frame. One important driver of Volatility are events. The bread and butter of SO, earnings events. Since Trump took office, single stock volatility also incorporates a lot of Macro Event vol and there are a lot more than normal. Best example is the one you used: SOFI. Expiry is 1st of August. Thats Trump’s Tarif deadline and that’s something effecting all businesses. Hence to the normal earnings expectations you got additional macro risk that is specifically fixed on one date. But Trump started taking some expectations out of the deadline by announcing the sending out of letters with deals about two weeks ago and about one week ago announcement of a deal with Japan and on Monday the deal with EU. Hence 1st of August premium got priced out after several parts of the big event got communicated down the road. Thats like pre earning releases. There are a lot of these Macro Events around. Hence, if you trade volatility, you need to be aware of these (extra)events and what the additional premium for these events are on top of the normal micro events. It’s ok trading on backtesting but you need to be aware of the future, hence if the future has addition risk that isn’t replicate in past comparisons. I can clearly say, the SO edge isn’t lost, you just need to be aware what expiry vols you are buying/selling and what (additional) risk they incorporate.5 points
-
I always like to use the analogy of the whole stock market. The stock market indexes produce average return of 10-12%, but that included several drawdowns of 20-30%. Some of those drawdowns lasted months or even years. Nothing goes up in a straight line. So, if you joined the stock market based on a long time return of 10-12%, would you quit if you experienced a 30% drawdown? If the answer is yes, then the stock market is not for you. If the answer is no, then SO is no different. We all would like all our trades to be winners, but we know this is not possible. We know some of the trades will be losers. Many traders think that if a trade has lost money, it was a bad trade. They try to identify what errors they made that lead to losses. Why? "Because I lost money! So surely I have made a mistake somewhere?” Was it the right conclusion? Is any losing trade necessarily a bad trade? The answer is no. No matter how well he executed his trade, there will be losing trades because we are playing a probability game. Trading is a business based on probability. And probability means that sometimes we get what we want, sometimes we don't. And that's the nature of this business. The sooner we accept this, the better we can operate it as a business. To put things in perspective, our model portfolio was up 10% in the first half of 2025. We had few bad trades in July and those put us back few percentage points. While those returns are way lower than expected, they are not the end of the world. We will refine our strategies going forward and I encourage everyone to look at the big picture. It is important to note that consistency in trading is important rather than changing everything when you get an adverse movement. Adaptation rather than revolution over time is the right way to go. Have our strategies lost their edge? This question has been asked many times over the years, basically every time we have a period of dull returns, and the answer each time has been "no, they have not". I believe this time is no different. Profits come in bunches. The trick when going sideways between home runs is not to lose too much in between - Michael Covel Since inception we had 13 months that produced 20%+ returns, and over 30 months that produced 10-20% returns. To win you've got to stay in the game. Our strategies worked very well for us for over a decade, and we have full confidence that they will continue working in the future. Those who have the patience will be greatly rewarded, like in the last 13 years. Members who have been with us from the very beginning know it very well.
 5 points
 -
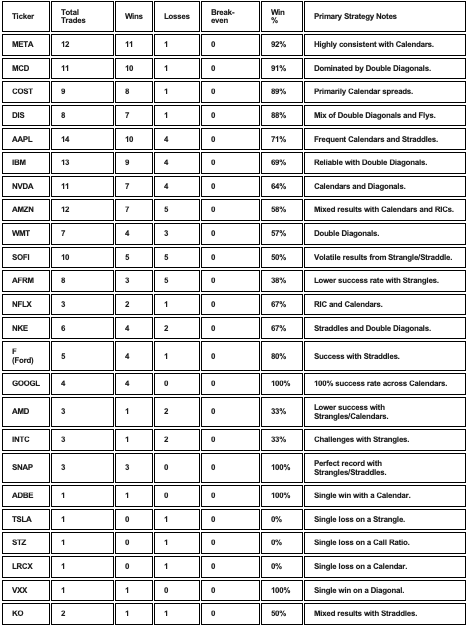
Aggregated Win Analysis by Stock (2022–2025)
 4 points
 -
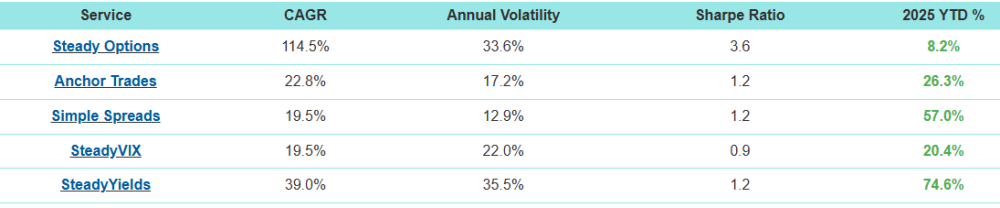
Thank you @Yowster for an excellent summary as usual. Few comments. First, we are definitely working hard to make adjustments to our strategies in order to get back to the previous years performance. Specifically: We will do more calendars even if the RV is slightly elevated, as long as there is a pattern of rising calendar RV. We will be using our newly introduced strategy Pre-earnings Iron Condors, but use a better risk management to prevent larger losses. We will be more selective with Hedged ratios and BWBs to limit the losses. Straddles/Strangles: we will likely try to cut the loss before it reaches double digits. As a general note, no strategy can work 100% of the time. Our model portfolio was still up in 2025, just not as much as in the previous years. The market conditions have been very different in 2025, and it's unrealistic to expect any strategy to work all the time. That said, our other strategies performed very well. If you invested an equal amount of money between all our services, your portfolio would be up around 37%. As always, diversification is the key. I don't know what the future holds, but I am confident that the strategies we use are solid and are based on probabilities. Sometimes it just takes more time for the probabilities to play out. I'm also aware that some people join based on 13 years of triple digit returns but cancel after a few sideways months. This is similar to someone who entered the market at the beginning of Covid in 2020, based on ~10% yearly historical returns, and exited a few months later after 30% drawdown, just to watch the markets more than doubling in the next 5 years.
 4 points
 -
A better strategy would be not to trade options that expire the same day. Extremely risky. A better strategy would be to understand what you are doing and asking questions before you place a trade. Learn first, trade later. And if you think education is expensive, try ignorance.4 points
-
Hi everyone, As some of you already know, I’m not only a fellow Steady Options member but also a physicist who loves coding Python tools to help me make better trading decisions—always grounded in probabilities and statistics. I’m excited to share that I’ve put some of these tools online at math-trading.com. One of the main ones available right now is my Monte Carlo simulation tool. Pricing: $39/month or $359/year (before applying the coupon). Special for SO members: you get 15% off all subscriptions until December 31, 2025. And here’s the bonus—new tools I’m currently developing (including a Monte Carlo + Credit Put Spread combo) will be added over time without any price increase. Feel free to check them out, and if you have any questions or ideas, just reach out through the math-trading.com website. Happy trading—and thanks for your trust! Romuald3 points
-
@Yowster thank you very much for this summary ... it was a tough year and my SO account ended up slighlty in the red (-0.31% before comms, -1.2% with comms).... but I am not deterred going into 2026 as this strategy has a risk:reward profile that I can better manage .... I have been working on improving my knowledge of the put calendar trade strategy so that I can be more proactive with my trades instead of waiting for alerts in the forum ... I will keep in mind the observation that RV's with slightly higher than previous cycles may make good trades ... thanks again to all SO members and looking forward to a prosperous 20263 points
-
Well, I wouldn't necessarily say that. The model portfolio is $10k, but I use a $20k portfolio so all my trades are double size. Since Yowster starting managing the strategy in July 2024, I've had total profits of ~$14,300 after paying ~$2735 in commissions. I just switched to using Tradier for this strategy in May, so most of the commissions are from IB. I'm pretty happy with it overall. Maybe I should have not overemphasized the commission difference in my prior post because if you can't use a cheaper brokerage, the results have still been pretty good with IB3 points
-
I use IB for a lot of trading, but these TLT trades, in my opinion, are too expensive there so I use Tradier for them. However, I made these trades at IB before I switched to using Tradier so I can give you real numbers on the commission differences. Over several hundred contracts of TLT butterflies at both brokers, my average commission per contract at IB was (EDIT: $0.5041....not the $1.138 I posted originally) and my average at Tradier is (EDIT: $0.11925...not the $0.214 I mistakenly posted originally. Tradier does charge a $10/month for Tradier Pro, which is spread across many other contracts for me. But even if you only traded these TLT trades at Tradier and you only did 15 butterflies per month, it would cost you around (EDIT: $14.31 commission...not the 25.68 I originally posted) + $10 monthly fee = $24.31. Whereas at IB, the same trade would be roughly (EDIT: $60.49...not the $136.56 I originally posted). Those are total costs to open + close just as a comparison of the difference3 points
-
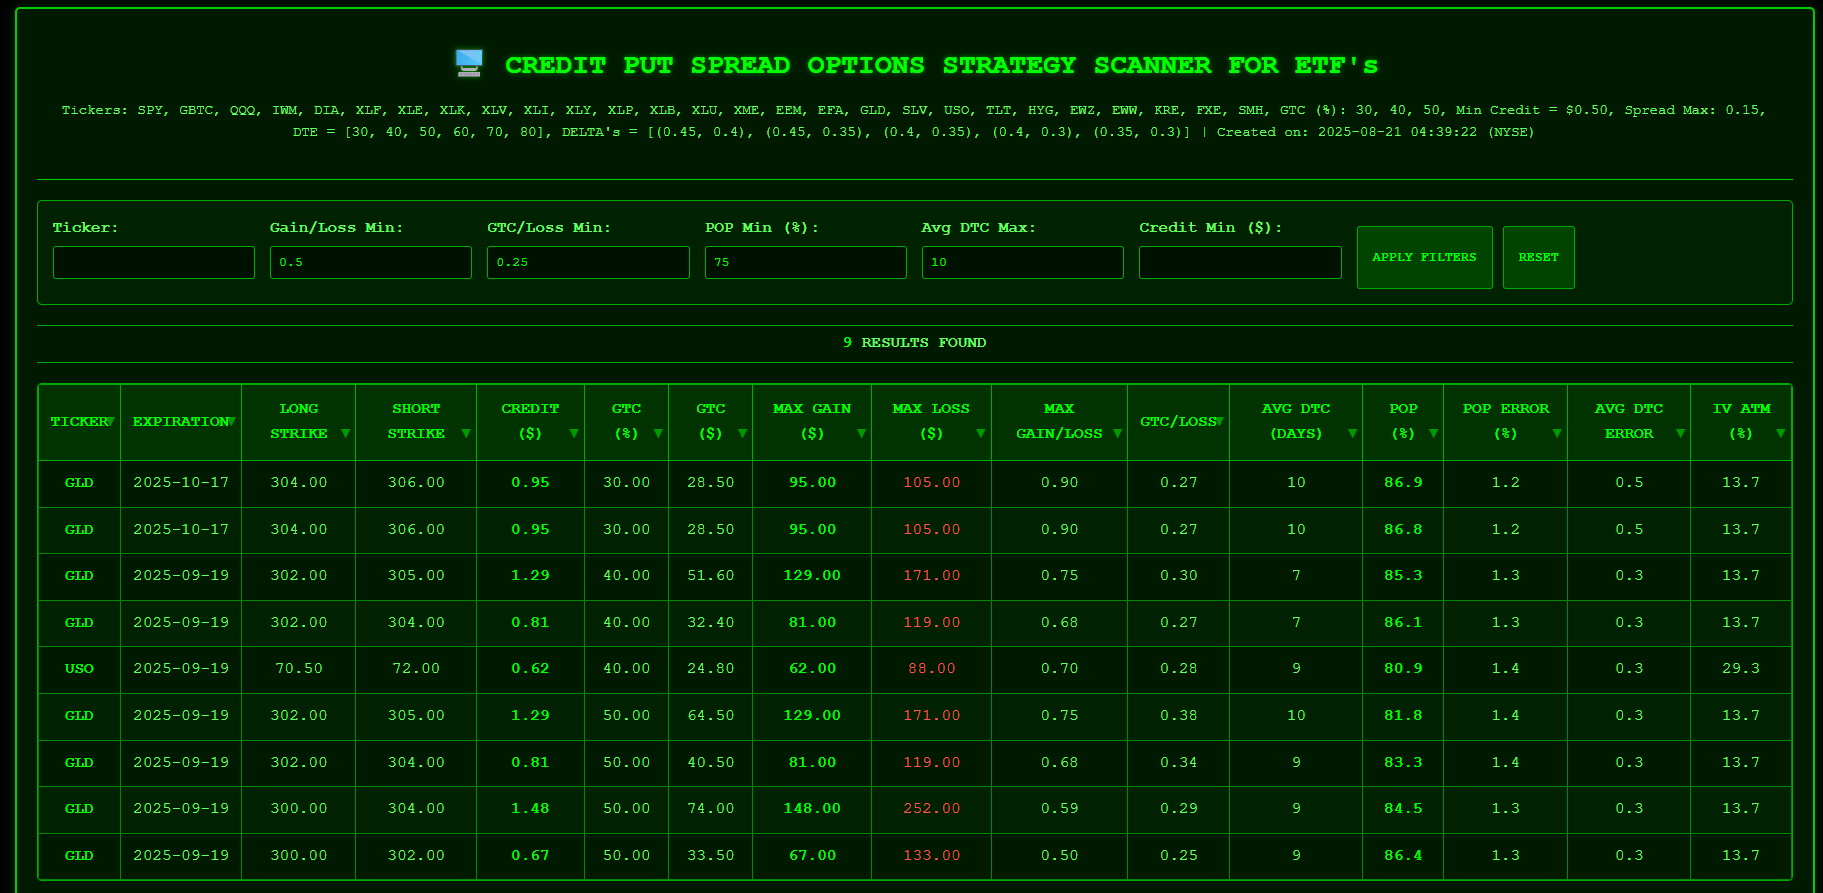
Hi everyone, I have added a new tool to my math-trading.com website. It is a table showing the results of a scanner that computes the Probability of Profit (POP) for Credit Put Spreads options trading strategies on some ETF's (the most liquid in options) using Monte Carlo Simulations. The Monte Carlo Simulation runs thousands of individual stock price simulations and uses the data from these simulations to average out a POP number, using the Black&Scholes formula. Unlike other calculators, this new tool lets you is a scanner and tries different target profits (as a percentage of maximum profit that will trigger the position to close when it's reached in the simulation. Here's how it works: The algorithm scans: ETF tickers For each ticker: DTEs between 30 and 60 days For each expiration, it tries different deltas combinations: (0.45, 0.40), # Short delta = 45, Long delta = 40 (0.45, 0.35), # Short delta = 45, Long delta = 35 (0.40, 0.35), # Short delta = 40, Long delta = 35 (0.40, 0.30), # Short delta = 40, Long delta = 35 (0.35, 0.30) # Short delta = 35, Long delta = 30 ] For each Credit Put Spread, for each day between today and the expiration date, it performs 5,000 simulations of Monte Carlo and, for each of the 5,000 prices obtained, applies the Black & Scholes formula to estimate the price of the initially opened Credit Put Spread. When the GTC of 30%, 40%, and 50% is reached, it looks at the number of days it took to reach it. If it is not reached, the Credit Put Spread is considered lost. It thus calculates, for all simulations, a profit probability and an average day to close. Note, of course, that the IV is considered constant and equal to the value when the Credit Put Spread was opened. The stock price volatility is equal to the implied volatility and remains constant. It makes the following assumptions for its simulations : Geometric Brownian Motion is used to model the stock price using Monte-Carlo simulations, Risk-free interest rates remain constant, The Black-Scholes Model is used to price options contracts, Dividend yield is not considered, Commissions are not considered, Assignment risks are not considered, Earnings date and stock splits are not considered, Of course, not all of these assumptions are true in real life and so there are limitations to this approach. For example, it's highly unlikely that the stock price volatility remains constant for several days. Thus, one should take these results with a grain of salt. Here are the results for yesterday 2025-08-20: On that image I have applied the filters : Gain/Loss min = 0.50, GTC/Loss min = 0.25 and Avg DTC (Day to Close) max = 10 : it means that I want the scanner to select the trades that have reached their GTC within the 10 days after the opening of the trade : this filter is because it is better to close these kind of trades once we get within a 2 weeks of expiration because gamma risk gets much higher closer to expiration. Of course you can click on each columns to sort by ascending / descending order. The computation process itself is very long, given that 5,000 Monte Carlo simulations must be carried out for every day over the 5 last years (for the history of Monte-Carlo simulations), for all tickers, for different combos of Deltas and different expiration dates. On my powerful PC, this takes about 3 hours, without running anything else. Therefore, it is only possible, on math-trading.com, to put the final results table every day. You can see in the image that I have put very interesting filters so that everyone can choose according to their wishes. I will put a complete user guide and deeper explanations in the coming days but, in the footer of the table, you already have a brief description of the different terms ("dictionary of terms"). I hope you all find this tool useful! In preparation : a new tool for calculating the Probability of Profit (POP) and the Average Day to Close for a lot of options trading strategies using Monte Carlo Simulations! Stay tuned! Romuald
 3 points
 -
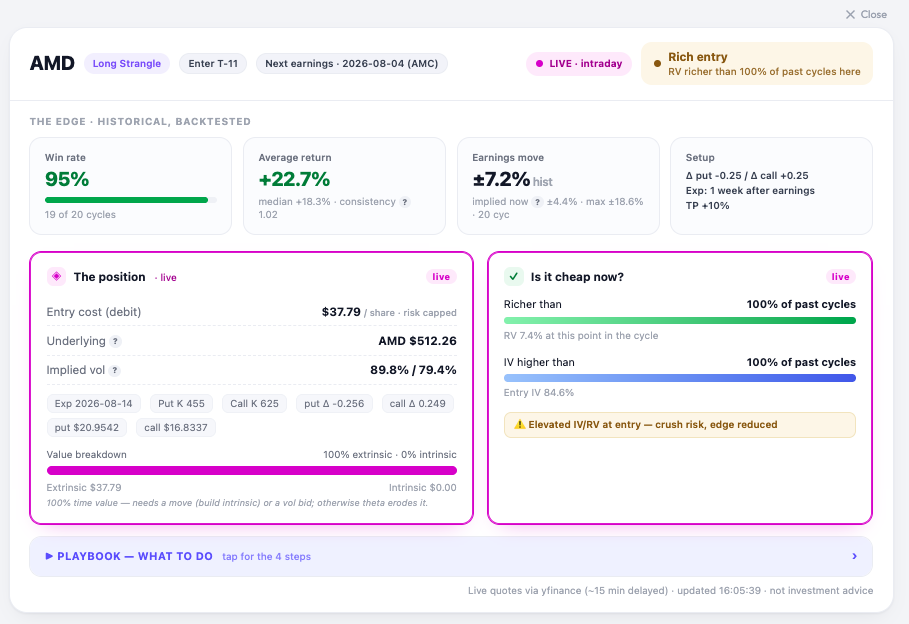
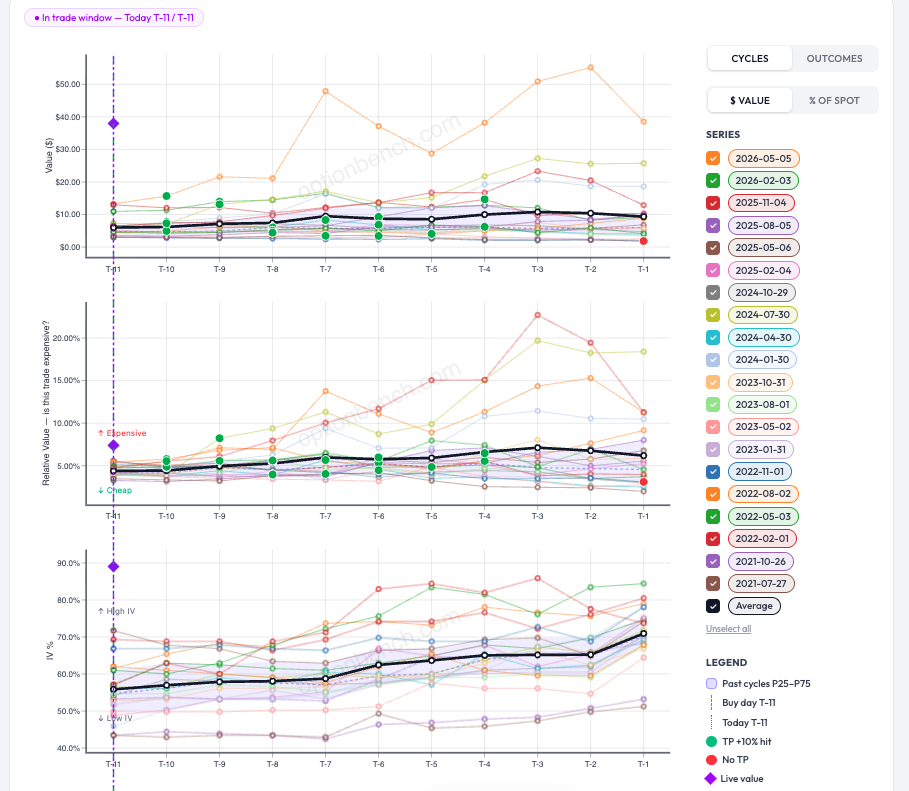
Update — at the open Markets opened, and here's AMD live: the strangle re-priced from $38.69 to $37.79, AMD gapped up to $512, and entry IV eased from ~87% to 84.6%. Marginally cheaper — but the verdict didn't budge: still "Rich entry," still richer than 100% of past cycles, still flagged for crush risk. On the charts, the live-value diamonds sit at the very top of every panel — value, relative value, and IV. Translation: the setup got a little bit cheaper, not cheap. It never dropped into its normal P25–P75 band, so the disciplined read is unchanged. Personnally I would pass, and let the backtest stay a backtest for this cycle. That's the tool doing its job: a 95% historical win rate is only worth having if you don't overpay to get in, from my POV. Romuald - OptionBench
 2 points
 -
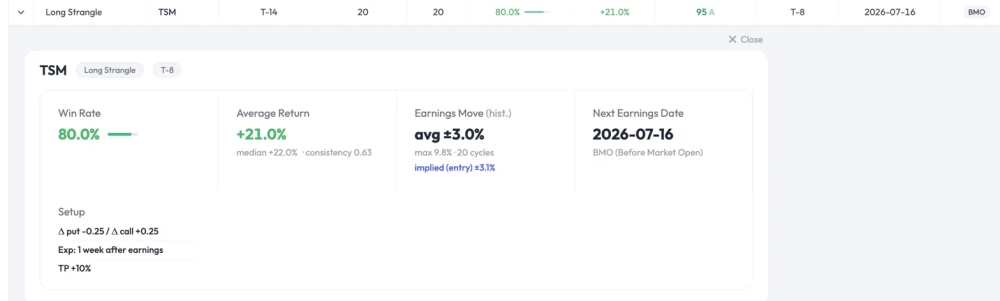
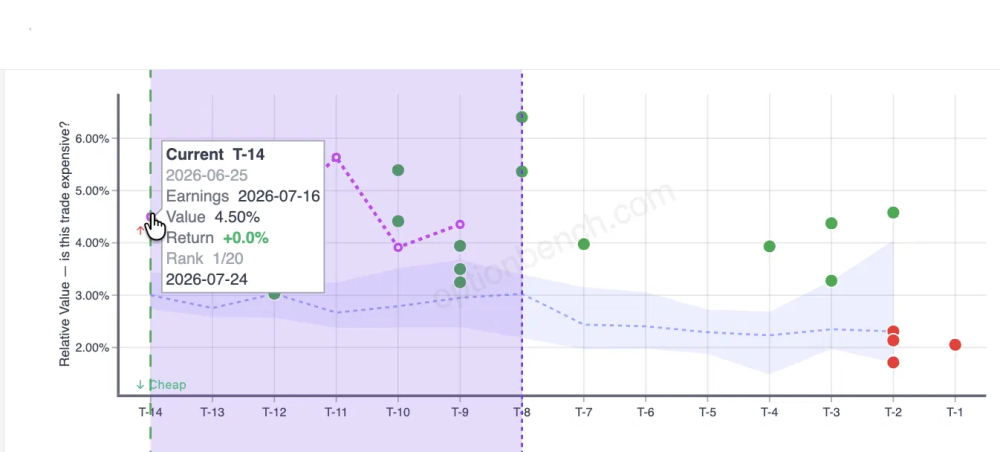
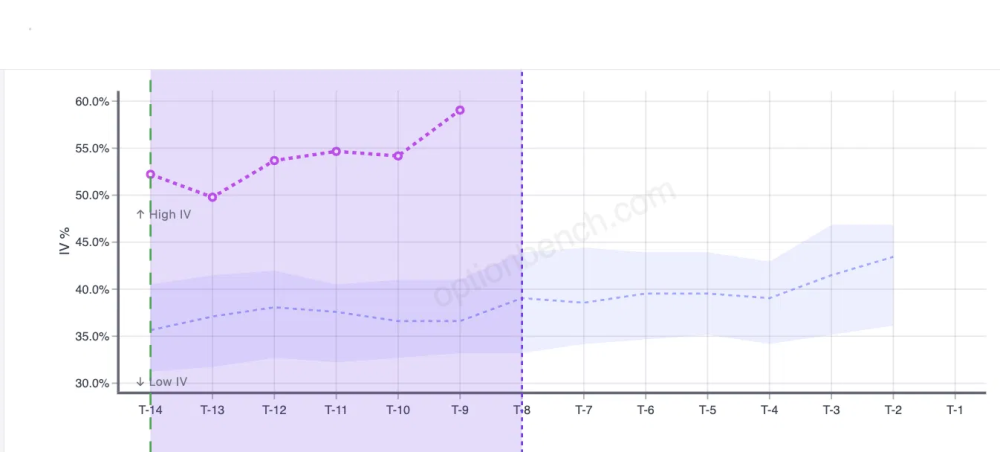
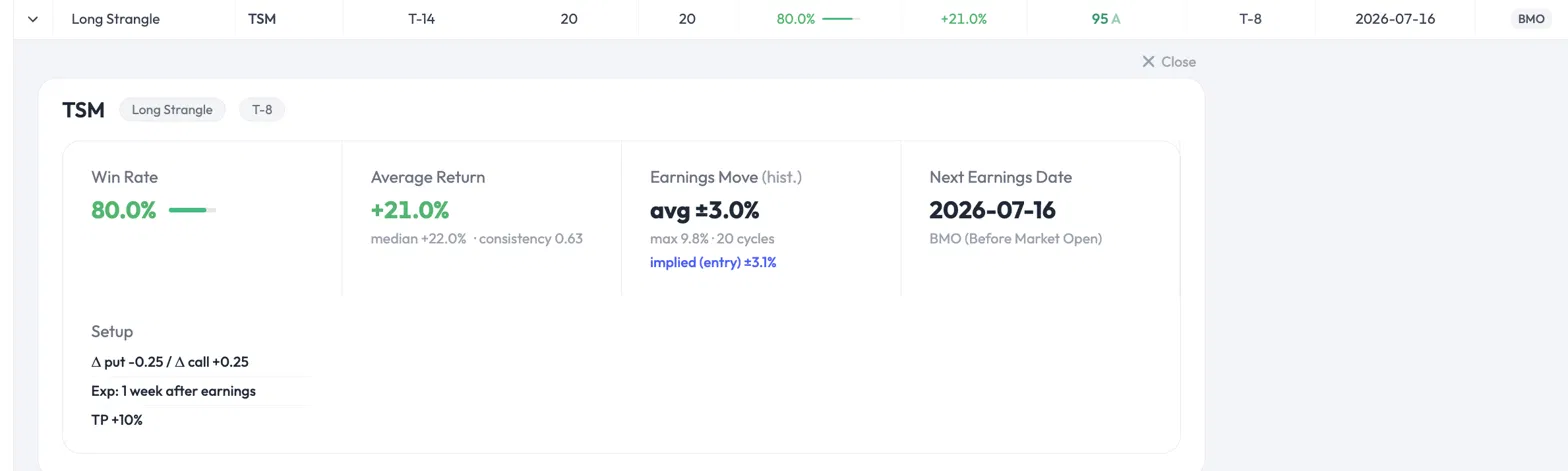
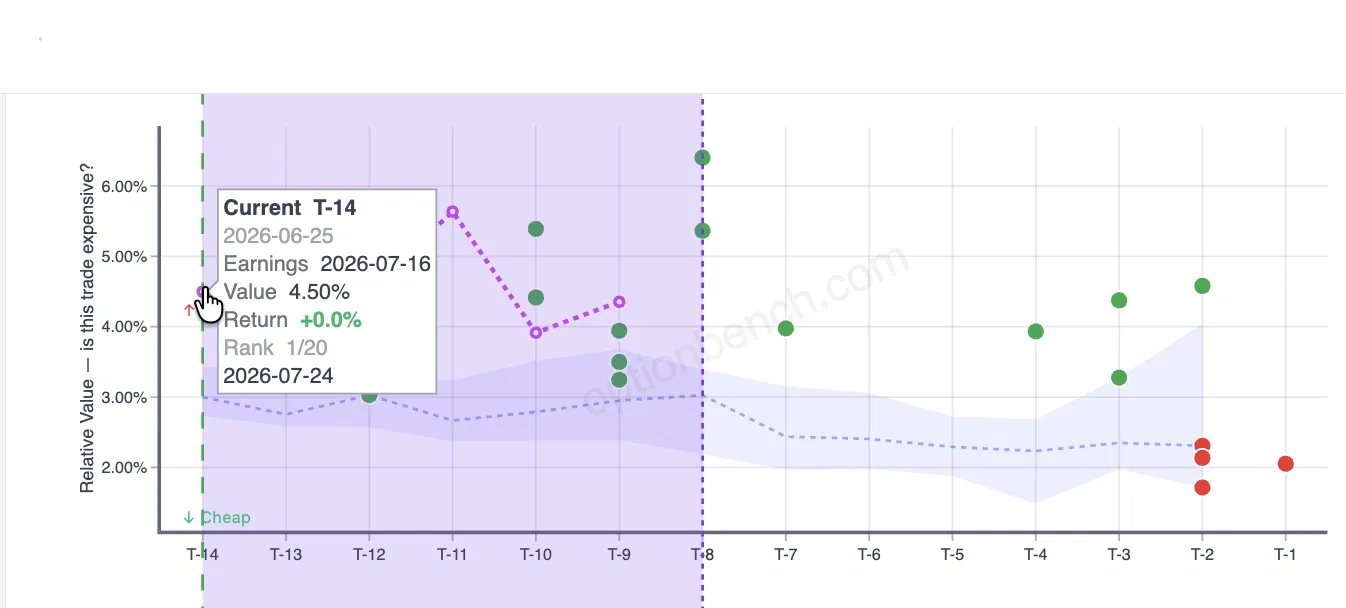
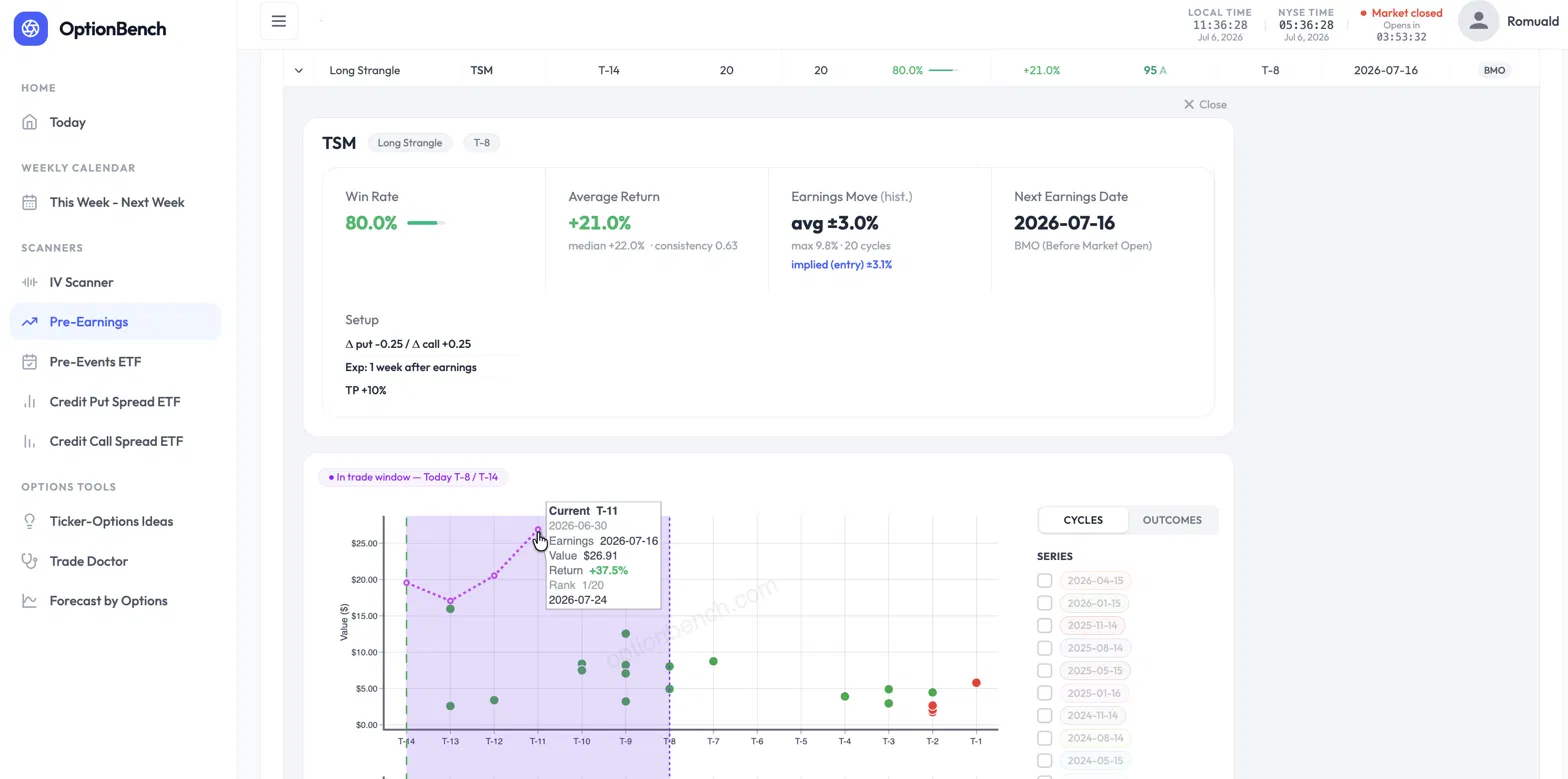
An 80% Win Rate on One of the Most Expensive Entries in the Ticker's History. Would You Take It? Here's a trade the OptionBench pre-earnings scanner flagged, and a question worth sitting with before you read the answer. [CAPTURE 1 — Win Rate 80% / Average Return +21% (median +22% · consistency 0.63) / Earnings Move avg ±3.0% implied ±3.1% / Next Earnings 2026-07-16] TSM reports earnings on July 16. The scanner flags a Long Strangle entered fourteen trading days out — on Thursday, June 25 — with Δ ≈ 0.25 on each side, expiring one week after earnings, taking profit at +10%. The headline numbers look strong: an 80% win rate over 20 past cycles, a +21% average return, a +22% median. Then you look closer, and two things should make you hesitate. First, the strangle is expensive. Its cost as a share of the underlying — the entry's relative value — sits at 4.5%, against a historical average of about 3.1% at this point in the cycle. Second, implied volatility is elevated: around 52% at entry, climbing toward 59%, well above the ~37% this name usually carries here. Every instinct trained on "buy low, sell high" says the same thing: it's expensive, IV is high, wait for it to come back down. And here's the part that should really give you pause — this entry isn't just above average. It ranks among the most expensive entries the scanner has on record for TSM at this point in the cycle, with implied volatility near the very top of its historical range. So: one of the most expensive entries on record, IV at its highs, and every reflex telling you to pass. Would you take the trade? The instinct that costs you the trade Most traders pass here, and their reasoning feels airtight: if it's the priciest it's ever been, mean reversion says it gets cheaper, so I'm overpaying. That reasoning conflates two different things — the price of the option and its expected value. They are not the same axis, and treating them as one is the single most common way traders talk themselves out of good pre-earnings trades. Let me show you why, with this exact trade, using numbers you can pull from the scanner yourself. "Expensive" is not the same as "overpriced" The first question a rigorous trader should ask isn't "is this expensive?" It's "is the market pricing the move correctly?" [CAPTURE 2 — Relative Value « is this trade expensive? », tooltip T-14 : 2026-06-25, Value 4.50%] The scanner answers this directly. Two figures sit side by side in the banner: Implied move at entry: ±3.1% — the move the strangle prices in, averaged across the 20 past cycles at this entry point. Realized earnings move: ±3.0% — the actual average move TSM has made on earnings, same 20 cycles. These are essentially equal. The market is not systematically underpricing TSM's earnings move, and it isn't wildly overpricing it either. The strangle is priced fairly relative to what the stock actually does. So if the option is fairly priced on the move, where does an 80% win rate come from? If the market gets the move right, the edge can't be coming from a mispriced move. It isn't. And that's the whole point. Where the edge actually lives The edge in this trade is not a bet that TSM moves more than the options imply. It's the capture of IV expansion into the event. [CAPTURE 3 — IV % : IV rising from ~52% (T-14) to ~59% (T-9), above historical band ~37%] You enter at T-14. The plan is a good-till-cancelled order to take profit at +10%, exiting before earnings and the volatility crush. And if the +10% never triggers? You still exit before the print — the position is closed at T-2 (for a before-market report) or T-1 (for an after-market one), no exceptions. You never carry the trade through earnings. That's the key risk control: this strategy has no exposure to the earnings gap itself, win or lose. In the window you hold the position, the option premium tends to inflate as the market crowds into the event. You're not holding through the print and hoping for a big move. You're buying anticipation and selling it a few days later, richer. [CAPTURE 4 — Value $, tooltip T-11 (2026-06-30) : Value $26.91, Return +37.5%, Rank 1/20] On the current cycle, that's exactly what played out. Entered at T-14 near $19.57, the strangle was marked at +37.5% by the close of T-11 (June 30) — and earnings hadn't even happened yet. Now, you wouldn't have pocketed +37.5%: your +10% GTC would have filled well before that, somewhere in the intraday tape as the position ran up. The realized gain is +10%, the take-profit. But that +37.5% end-of-day mark is the evidence that the target was hit comfortably, and early. The move you'd have been "waiting to see" is irrelevant to this trade, because you're out before it happens. This reframes "expensive" and "high IV" completely. They aren't warning signs to avoid. They're the fuel. A cheap, low-IV strangle would have far less premium to expand. You want the anticipation. You're selling it, not buying into it. (One honest note for the careful reader, because it matters: the "realized move" measures the one-day earnings gap, while the "implied move" is priced by an option that lives a full week past the event. They're not a perfect apples-to-apples comparison — the option captures the gap plus residual post-earnings vol. If anything, that makes the "fairly priced" read conservative. I'd rather flag it than have someone catch it and assume I was hiding it.) What should have driven the decision Not the price. Not the IV level. The conditional statistics — the numbers the scanner exists to surface: Win rate: 80%, conditional on entering at T-14, over 20 cycles — meaning 80% of those cycles hit the +10% take-profit before the event. (It's a TP-hit rate, not a vaguer "was it green" rate; worth being precise, since it's the number the setup is actually built around.) Average return +21%, and — this is the one that kills the "it's an outlier" objection — median return +22%. The median sitting at or above the mean tells you the average isn't propped up by one lucky cycle. The typical outcome is a strong winner. This is a regular edge, not a lottery ticket. That distinction is everything. An 80% win rate with a median of +22% is a fundamentally different animal from an 80% win rate where the average is dragged up by a single monster cycle while everything else limps. The scanner shows you which one you're looking at, and here it's the good kind. The honesty that makes this defensible I'm not going to pretend this is a free lunch, because it isn't, and the scanner won't let me pretend. There's a consistency ratio of 0.63 on this trade — mean return divided by the standard deviation of per-cycle returns. It measures how regular the edge is, and 0.63 is moderate. The edge is real and it repeats, but there's genuine dispersion: the 20% of cycles that lose, lose meaningfully. This is a trade to size with control, not to back up the truck on. That's not a caveat buried at the bottom. It's the point. A tool that only ever tells you a trade is great is a marketing tool. A tool that hands you an 80% win rate and a 0.63 consistency ratio in the same breath is giving you what you need to size the position honestly. And one more line I won't blur: the current cycle is a single live data point, and a single data point proves nothing. That the take-profit was hit early this time is encouraging, not evidence. The case for entering doesn't rest on it. It rests on the 20-cycle conditional distribution: 80% of cycles hitting the +10% target, a +22% median across all of them. The live cycle is an illustration of that statistic playing out, not the proof of it. If you take one thing from this piece, take that sentence. The takeaway Don't confuse the price of an option with its expected value. They live on different axes. An option can be among the most expensive it has ever been — near the top of its own historical range, IV at its highs — and still be the right trade, because the price of the option and the odds of the trade are two separate questions. "Expensive" answers the first. The 80% win rate, the +22% median, and the 0.63 consistency ratio answer the second. That second set is what should drive the decision. The whole reason a tool like this earns its place is that it puts both answers on the same screen — so you're not passing on a good trade because an instinct trained on the wrong axis told you it looked expensive. Numbers in this piece are pulled directly from the OptionBench pre-earnings scanner (TSM, Long Strangle, T-14 entry on June 25, 2026, 20-cycle sample). Every figure — implied vs. realized move, median return, consistency ratio, entry relative value — is visible in the tool. Verify them yourself; that's the point. Beta-testing is ending by the end of July but you can still give your feedback and ask for signing in on the OptionBench Beta Web Site.
 2 points
 -
Yes, they are. The SEC announced the change on April 16, and allowed brokerages 18 months to implement it .This link from Schwab explains the change. In short: "...Under the new rules, traders will no longer be required to maintain a minimum account balance of $25,000 to engage in frequent margin day trading. Instead, eligible margin accounts of more than $2,000 will gain access to intraday margin buying power set by individual brokerages based on current positions and maintenance margin requirements. Currently, under the old rules, four or more day trades in five business days triggers a "pattern day trader" designation and the $25,000 requirement. Under the new framework, the pattern day trader designation will be eliminated, and day trades will no longer be counted...."2 points
-
I think it is specific to META, because there was some confusion in the code that it was trying to retrieve the stock price of FB instead of META sometimes and sometimes it was getting it from META. I think the RV calendar of META should be better now. I've added an override for GE, but just to be clear, it is the responsibility of each trader to confirm the earning date / time by looking at the official investor relations website. That is the only source of truth.2 points
-
We are pleased to expand our services offerings with a new strategy called SteadyYields. Here are the service parameters: Tailored for medium term active traders Model portfolio size - $10,000 Underlying -TLT Average holding period - 2-4 weeks 25-30 trades per year Profit target - 30-40%+ annually There is a long-term correlation between oil prices and constant maturity yields for the 10-year Treasury. SteadyYields is a trading strategy that takes advantage of this correlation. The strategy uses mix of strategies about 30-45 days from expiration. The spreads are designed to take advantage of the direction oil has provided, whether that be long, short or neutral. Details can be found on the members forums discussions. In addition, there are trades based on Monte Carlo simulations (employed to estimate the probability of exceeding a specific value) using very liquid, optionable ETFs such as GLD, QQQ, XLE etc. We recommend executing TLT trades with a low or no commission broker (like Tradier or FirstTrade). TLT is extremely liquid, scaling up will not be a problem.2 points
-
Recent GLD, IWM and AMZN trades traded 1 spread per $25k model portfolio (average size was around $2-2.5k per spread, close to 10% of the model portfolio). So with $1M account, you would do 40 spreads. I would say very doable for those stocks. Of course some stocks are lower prices and slightly less liquid, so for the model portfolio they traded 3-5 spreads, so you would need 120-200 spreads. Still doable, but you might experience a bit more slippage. Still, if you trade a $10 spread, even paying few cents more is not a big deal percentage wise. So the bottom line is: very easy and scalable for $100-300k accounts, a bit more difficult but still doable for $500k-$1M accounts.2 points
-
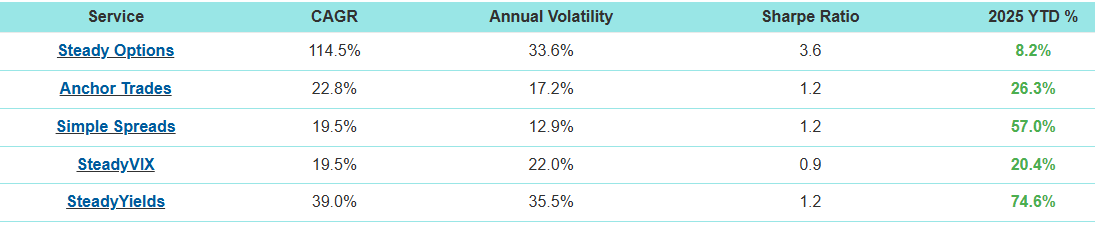
SteadyYields 2025 Summary: SteadyYields is our best performing service in 2025, producing 74.6% return. As always, we aim to under promise and over deliver. The strategies use highly liquid instruments like TLT, GLD, QQQ, XLE etc. They are fully scalable, low maintenance and easy to follow. Considering that we usually risk only 50-60% of the model portfolio at any given time, and the return includes one large loss, I consider the performance beyond remarkable. Many thanks to by our contributor @Romuald for designing the algo and our contributor @Yowster for managing the strategy. The service is only $150/month or $1,200/year and based on the performance, the price is expected to increase in 2026. This should be a $500/month service. If you started 2025 with $100,000, your portfolio would be up $74,600 by now. Not a bad return on $1,200 investment.2 points
-
I had to restrain my laughter so I won't wake up my wife!!!!! (punch line:"googled it" !! Sarang2 points
-
It turns out that my issue was based on a misunderstanding. I am not permitted to trade TLT for the reasons given above but I am permitted to trade TLT options. Thankfully I can still follow the SteadyYields trades.2 points
-
I trade using IB (I am in France) and I never met this kind of issue. From my experience, it turned out that they always replied to me when I add a problem, even if it was with a certain delay by mail. You can also directly call them and ask.2 points
-
Welcome to Steady Options! Please spend few minutes to read this post, the Frequently Asked Questions and the Useful Links. It will be time well spent. SteadyOptions is a premium options trading advisory service. We offer a combination of a high quality education and actionable trade ideas. Our forums and the trading community are the heart of the service. The focus of the service is on non-directional strategies like Long Straddles/Strangles, Calendars, Butterflies, Iron Condors etc. We always trade defined-risk strategies, never naked options. You need to create a forum account to get access to the service. We are sharing our trades with full explanation of the Greeks, the risk/reward, the best time to entry/exit, price targets etc. Full follow-up is provided, including entry, adjustments and exit. You might expect 10-15 trade ideas per month. We will usually have about 4-6 trades open, some are short term (2-6 days), some medium term (3-5 weeks). We use portfolio approach and will have trades balancing each other in terms of theta/vega/gamma. Please note that suggested portfolio size for SO trades is $10,000-$100,000. We do NOT recommend trading accounts larger than $100,000 due to potential liquidity issues. We recommend using one of our other services for larger portfolios. We will also provide options education. I encourage you to ask questions about options trading. Please note that we don't provide auto-trading. SteadyOptions is an educational resource. I want my members to be in a full control of their trading. In addition, SEC considers newsletters that engage in auto-trading to be investment advisers, and I am not licensed to be an investment adviser. So most newsletter that engage in auto-trading are breaking the law and are exposed to lawsuits like this one. You can read more details here. The SteadyOptions forum has several sub-forums (access to members only): SteadyOptions Trades - this is where the official trades are posted. Any trade posted on this forum by any of the contributors @Kim @Yowster @krisbee or @TrustyJules is considered an official trade. SteadyOptions Discussions - This is where we discuss our trades. Unofficial Trade Ideas - This is where we discuss our unofficial trade ideas. In addition, SteadyOptions members have access to all Members forums where we discuss general issues, strategies etc. You can start topics and post on each subforum except “Trades Discussions” and “SteadyOptions trades”. You can reply on “Trades Discussions” forum. Each trade has a separate topic in “Trades Discussions” and “SteadyOptions trades”. The SteadyOptions Trades forum is used for posting our trades. To get notifications about my trades, you will need to follow that forum (by clicking "Follow this forum" button). Each trade has a separate topic, with our entry price, exit price and some comments. We will start a topic for each trade in the “Trades Discussions” subforum and you will be able to post your replies. You will need to specifically follow each forum you want to get updates from. When you follow the forum, you will get an email about every new topic in that forum. If you are interested getting emails about new posts in that topic, you will need to follow that topic. We recommend to follow all forums to get notified when new trade or trade discussion is posted. You can also follow specific members to get notified every time they post. SteadyOptions model portfolio is based on 10% allocation per trade (some trades are 5% and considered half allocation). Average of 5-6 trades is open at any given time. Performance returns are based on the entire portfolio, not just what was at risk. Please note that we usually don't hold our trades through earnings, unless specifically indicated. More details: Why We Sell Our Straddles Before Earnings Why We Sell Our Calendars Before Earnings Our goal is to share our experience and to help you to become a better trader. The trading notifications are based on our real trades that we are sharing with subscribers in real time. SteadyOptions is not a recommendation letter and I am not a financial adviser. However, let me give you few general tips: We encourage you to do your own homework before following any of our trades. If you are new to options or to those strategies, start with paper trading, then start small and increase your allocation as you gain more experience and confidence. Try to understand what we are doing. Ask questions. This is why we have the forum, and we welcome questions and discussions, no matter how basic they are. Don't wait for our notification if you like the trade. Enter if you like it. Exit based on your own profit targets. Our advice to members: learn the strategies and make them your own. Do NOT blindly follow the trade notifications. You need to understand what we are doing in order to adjust your entries and exists to changing market conditions and be proactive. SteadyOptions is a trading ideas generator rather than an alert service. If you are using it as a pure alert service, you are not taking advantage of all the wealth of knowledge and learning we offer. If you expect a pure alert service where trading alerts are just delivered to you without any effort and time commitment, this service is not for you. You will be expected to invest time and effort, please do NOT sign up if you are not willing to do it. I recommend reading My Seven Stages of being an SO Member to get a better understanding of how veteran members are using the service. My commitment to you: I want to make money with you, not from you. All I ask from you is to give me a fair chance. If you decide that you like the style, give it some time to work. Don't give up after a couple of bad trades. We are here for the long run. Don't concentrate on short term performance. Concentrate on your education. Concentrate on managing risk. If you do that, the profits will come. How to make the best use of SteadyOptions For the benefit of the new members, here is how SteadyOptions works and how to make the best use of your subscription. We use a limited number of non-directional strategies, described in the following topics (access to members only): SteadyOptions strategies How we trade straddles and strangles How we trade pre-earnings calendars How we trade Iron Condors How we trade Calendar Spreads How we trade butterfly spreads Full list of "Must Read Topics" is displayed on the right side on the main forum page. Please make sure to read it. You will need a margin account to trade most of those strategies. Here is how we trade the earnings trades: Every week we post post a list of trading candidates for the next week in Earnings Trades Discussions forum. We have some general discussion about the candidates. We will post a separate topic for each candidate I think it suitable, with analysis of the suggested prices, average move, previous cycle etc. The topic will always include a link to one of the relevant strategy topics above. This allows members to do their homework and to see if they like the potential trade. If you agree with the analysis, you can go ahead and make the trade. We will try to get the trade at the best possible price. When we do, we post it under the Trades forum. You should follow this forum to get email notification about the trade. We recommend that you try to get the trade as close as possible to the alert price. We don't recommend chasing trades. We cannot tell you what is the maximum price you should pay. It is your decision. Sometimes you will be able to get the trade the next day cheaper. Sometimes you will miss the trade. We make about 10-15 trades each month in our model portfolio plus similar number of "unofficial" trades. Don't feel obligated to take all of them. After entering the trade, please set reasonable price target. We usually start with fairly aggressive target and lower it as we get closer to earnings. Please look at liquidity, especially if you trade large amount of contracts. For our earnings trades, it is very important to close them before earnings to avoid significant loss. Here is an example of a discussion topic: And a following trade notification: In addition to earnings trades, we also trade different non-directional strategies not related to earnings. There are also many unofficial trades in a dedicated Unofficial Trade Ideas forum. Those trades are not tracked but they are integral part of the service. They are usually posted by me or one of our Mentors and are based on the same strategies as official trades. They don't make it to the "official" model portfolio for various reasons, such as: model portfolio full, size of the trade too big to fit the $10k model portfolio etc. We set different profit targets and stop losses for different strategies, and we also recommend that members set their own price targets. The best way to use SteadyOptions is to learn the strategies and make them your own. If you do that, you will be able to take full advantage of our service. You will be able to make your own decisions, based on our discussions. Getting good fills is part of the learning process. Over time when members gain more experience, they learn how to get better fills. Many members started as complete novices and now they take the trades even before I do and get better results in some cases. But those things take time. I highly recommend following the discussion topics to see how other members utilize the service. I also recommend following our Mentors for valuable tips and insights (more about our Mentoring Program). If you cannot get a fill on the exact trade, there are many ways to trade the same strategy (using different strikes, different expirations etc.) If you understand how our strategies work, you will be able to do it and see what other members do. I see the community as the most valuable part of the service. New members, please spend some time getting familiar with the forum and the strategies before jumping into live trades. Why SteadyOptions is different There are many services that trade exclusively one strategy, like credit spreads. While they might make decent returns 9-10 months per year, 1-3 bad months when the markets make sharp moves can wipe out months of returns. At SteadyOptions, we offer a complete portfolio approach. We use a diversified approach by trading a mix of non-directional market neutral strategies and balancing the portfolio Greeks. In order to hedge our theta positive gamma negative trades (like Condors and Calendars), we will always have gamma positive trades like straddles or strangles. We will discuss the following key elements for our earnings trades: Which strategy is appropriate for the specific stock. When is the best time to enter. What is the optimal entry price. Backtesting of previous cycles. What is the appropriate adjustment. What is the profit target. How Theta, Vega and Gamma impact those trades. Please make sure to read Frequently Asked Questions for more details. Finally, a quote of one of our members: I see SO as an educational course with live trades examples and the ability to discuss them with a like minded community. I don't expect or frankly care to perform as well or the same as the official returns, for the most part I don't even enter official trades unless it fits with my own strategy. Or the sectors/symbols that I like investing in and a myriad of other factors. So far, I learned a great deal directly and indirectly from SO and see a good ROI from both trades and knowledge accumulation. The truth is that about 90% of options traders will either breakeven or lose money. The same applies to any competitive sport or business, 90% will give up and stop playing, 9% will be considered average or good players and the top 1% the pro athletes will thrive. The copy and paste approach doesn't work for options... there are no shortcuts. Don't expect to look or learn how a marathon runner is running and expect to be able to run the marathon faster or even at the same pace. A person search for a one solution fix all or the "holy grail" is futile, there is no such a thing. The only thing that works is hard work, dedication and continuous learning. Every athlete will tell you the same.


 2 points
 -
This is an excellent question, and I completely understand the concern, considering the history.. We manage risk in the following ways: First is position sizing. We typically don't utilize more than 50-60% of the model portfolio. The main trade (based on the algo developed by @Romuald) is around 30% ($3k) and there are 1-3 extra trades based on Monte Carlo simulation tool. Second is managing the negative gamma. The trades are typically opened 5-7 weeks to expiration and closed 2-3 weeks to expiration, to reduce the negative gamma. That said, sometime even the best intentions go wrong. Last week we closed the long term bullish TLT trade that was opened months ago and went against us right from the beginning. We held it to give the thesis to develop, but unfortunately it didn't happen, and the trade was closed for $2,700 loss. Along with two other trades, we will record ~18% in October. This is probably as bad as it gets, but considering the fact that we make around 5-7% a month on average, we consider it an acceptable drawdown. We will be still up 56% in 2025 in 10 months, far exceeding our profit target of 30-40%. Hope this answers the question.2 points
-
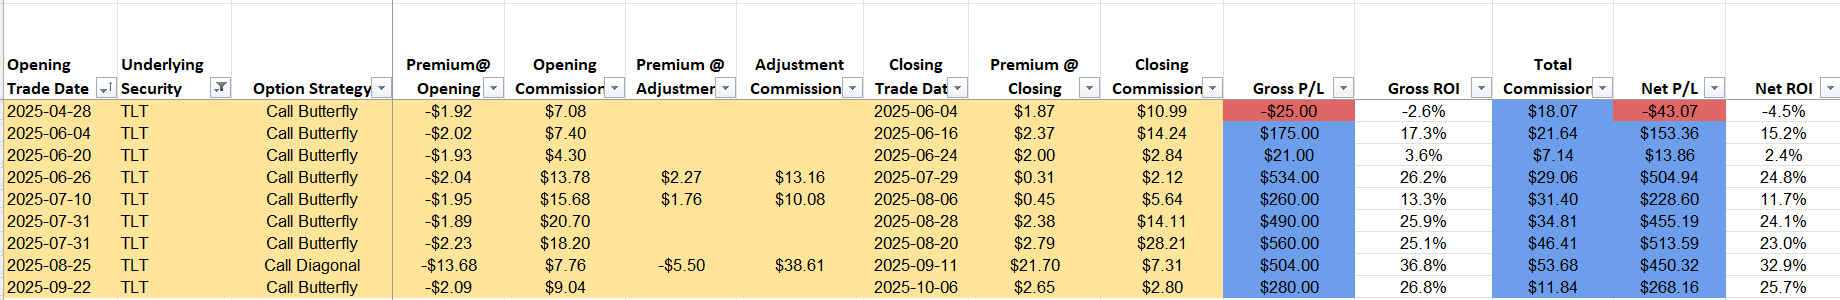
No, you're right. Sorry for the mistake. I'll update my post so noone is misled in the future. I did a quick formula on the last 5 butterfly trades at IB and last 3 at Tradier and failed to double the contracts at IB to account for open + close, so my numbers for IB are off. The funny thing is I looked at the last IB trade to verify it looked right and on that particular trade, the cost/contract was about $1.10, so I assumed the overall number was correct. Thanks for pointing that out. So I went back and looked at all TLT butterflies I've traded since 2024 and the actual cost/contract at IB was $0.5041. The actual cost/contract at Tradier was $0.11925. The other numbers I posted on total commissions paid and net after-commission profit is correct, though - that includes all SteadyYields trades and not just TLT. (As a side note, I had a few months where I traded more than 10k option contracts at IB, so I believe that made commissions lower than normal just on those months)2 points
-
@Yowster @greenspan76 here are my YTD trades in SY for TLT ... I use IB as there really is not another brokerage to use in Canada at least for options ..... so yes the comms are high but still making good returns
 2 points
 -
@greenspan76 your comment about your experiences with IB commissions on the TLT trades made me look at my commissions for every 15-lot TLT fly this year. As you know IB commissions vary, but my range across all of those trades was a low of ~$0.35 and a high of ~$1.05 per contract (with only two trades of paying $1.00+). The average across all those trades was ~$0.60 per contract, so much lower than what you have observed. At that $0.60 rate the total commission to both open and close the trade was $4.80 for each fly (4 legs on open and close) - and with each fly typically costing ~$200 that commission is 2.4%. Ideally, I'd like under 1% impact per trade, but these are 4 leg trades so while not ideal the commission impact is bearable. Of course if you can lower fees and the same fills with another broker then that is better. The question is why your IB commissions are so much higher than mine, I have nothing special or out of the ordinary tied to my IB account.2 points
-
The losses were with the previous manager who did a terrible job. Yowster has been managing it since the other guy was ousted, and there has been good returns. Read the postings on the Forum or follow Kim's email updates on Steady Yields. Sarang2 points
-
1. IBKR is a very low commission broker. I have used them for several years with both Steady Yields, and also better yet with Steady Collars strategies. Their commission structure as well as low Margin interest rates allow you to keep most of the profits for yourself. 2. You can read about it in the Forum Steady Yields Sarang2 points
-
As you probably know, each dot represents the midpoint price of the position at different points in time throughout the day. When you see bigger variations like this with the dots when the stock price stays around the same level its likely that the bid/ask spreads are wider so the midpoint price is jumping around a lot. It can also be a bigger change in RV but that is less likely.2 points
-
@TradeBobby @Bhavan1986 I think I have found the issue, but it's going to take many hours to reimport and recalculate everything.2 points
-
Yes, most of the time it is possible to enter hours after the trade has been posted, sometimes even the next day. Of course the entry will depend of the underlying price - if the price moved significantly, sometimes the trade price can change as well. But for the most part, those are very slowly moving trades. The implementation is very different from the previous one. Yes, June 2024 performance would be very different from the previous implementation. In fact, it is possible it would actually make money in June 2024.2 points
-
Profits come in bunches. The trick when going sideways between home runs is not to lose too much in between - Michael Covel I keep repeating this quote again and again, just look at latest Simple Spreads performance. Every drawdown in S&P 500 was followed by a monster rally (it is now up over 30% from its April lows in just 3 months). Every time SO was "underperforming" for a few months, was following by a monster year.
 2 points
 -
Great analysis, and with candor and transparency, too. Thank, Kim. The comment about directional trades did resonate with me, as I have been watching them from the sidelines, or had modified my own trade away from the official. Directional trades probably have their place in a basket of strategies. However when they deviate from the core thesis, it's a red flag for me. Many such trades started out delta positive right off the bat, with no (or not enough) room for error - just the hope that the stock would revert if it went south (pun intended). Somewhere in my basket of wisecracks is a saying that goes "Hope is not a strategy". In such cases I tended to stick with the original thesis, which worked better, or at least add a simple hedge - one that is understandable by the lay person - kind of like like we do with our Double Diagonals, where a calendar is added to mitigate the non-movement of the stock. Taking the loss on a bad trade and moving on is another thing that traders tend to postpone, and then find themselves in trouble. The persistent red values in the daily trade log that present themselves hour after hour and day after day tend to make traders obsess over recovering from them which takes away time from finding potentially successful new trades. Someone had mentioned a while ago, and I agree whole-heartedly, that there is a psychological cost to staring at ugly red losses on a continuous basis. I personally tried this "different" discipline earlier - that is, mostly sticking to the defined max loss and/or profit targets - and my trading became more fulfilling, the losses smaller in number and value, and profitable trades more numerous. Even the moments of depression were fleeting when the closed losing trades were put aside in the cumulative trade log, leaving the active log looking a whole lot healthier. The wonderful thing about SO is the thinking, back-testing, discussion and evolution that have formed all the core strategies, and this time is no exception, I'm sure.2 points


This leaderboard is set to New York/GMT-04:00