Leaderboard


Popular Content
Showing content with the highest reputation since 04/17/12 in Posts
-
Like many other new members, I went through a frustrating time on Steady Options. I almost gave up on it very early on, but luckily, I hung around. Having been here a while now, I’ve seen other newbies come full of enthusiasm and leave full of disappointment, walking the same frustration-filled path that I left behind. I’ve examined my own journey, and can break it down into various stages. So, here they are. Other peoples’ journey may be very different, but I hope that my pathway may shed some light, or give some hope to others who find themselves shouting at the cat for no reason, like I once did. 1) Initial Enthusiasm I joined full of hope and excitement, lured by the mouth-watering annual returns, thinking “If I can make even half of those returns, then I’ll be a happy-chappy”. Motivation Level : 10/10 2) Frustration with Fills Okay, I’ve been a member for a few weeks, and have tried to enter a few trades, but each time, I cannot even get close to the official entry price. I give up on many trades and enter others at the wrong price, resulting in more losers than winners. Motivation Level : 7/10 3) Frustration turns to Fury (well almost) It’s now many trades later and the fills are not getting any easier. It’s getting annoying seeing others open trade after trade and close it two days later at a profit, whilst my GTC order to buy is sitting idle on some exchange gathering dust. I’m a mild-manner guy, who wishes no ill-will on anyone, and thought I didn’t have a dark side, but the ugly monster of jealousy is tapping me on the shoulder and saying “Damn, there’s another guy who’s just closed the GOOG calendar for 30% ….AND….he’s gone in and out twice already this cycle, whilst you can’t even get in once?”. I'm anything BUT a happy-chappy. Motivation Level : 3/10 4) “I’ve had enough” Months have rolled on, my SO portfolio is not showing any gains whilst the official portfolio is showing a healthy number. I don’t even bother trying to enter any SO trades now, and hardly logon to the forums. I’m bitter and just waiting for my membership to expire. Motivation Level : 1/10 5) The last Attempt Over a year has gone by, and the anger and frustration has turned to “Let me give this lousy service one last chance, before my membership expires”. I register with one of the two charting services (ChartAffair/VolatiltyHQ), and spend the whole weekend reading up on old trades, and asking myself “Why did Kim enter this calendar at this price? How does he know that it should be a 1-week or a 3-week calendar?” I look at the RV charts and start to see that the official trades are entered at very low RV’s and every time I over-pay, I’m reducing my chances of profitability. I’m seeing patterns in the calendar RV charts – a ramp up as we get to earnings, a zig-zag pattern that allows others (who I envied) to go in-and-out of trades multiple times. Same for the RV charts for straddles. I’m starting to see why Yowster thinks something is a good buy or not. My head is filled with little “ah-ha” moments and learnings, and the next few days I watch live prices and then I do the un-thinkable – I open my own calendar trade on PANW for 0.89. The very next day, Kim opens the same Put calendar for 1.05 – Bingo! I feel a sense of un-controllable excitement, not just cos I received validation that my trade was correct, but that I actually got a better price than the official. (https://steadyoptions.com/forums/forum/topic/4106-trades-panw-november-2017-calendar/?tab=comments#comment-87397) Motivation Level : 7/10 6) Creating my own Trades I spend Nov and Dec ’17 coming up with tons of my own trades – calendars and straddles. I'm not really too sure of what I'm doing, so some are winners and many are losers. I’ve started doing something else – I’m now keeping a proper journal. Every trade is logged together with the rationale behind it. If it goes wrong, I try to understand why. I’m trading full-time and this has become all-consuming, but I am enjoying it. My knowledge and skill level is rapidly increasing. For the first time, I make a profit for the month (12.9% for Nov ’17). I’m on a high. I still try to enter official trades, but don’t get upset if I miss many. I do this for a few months, averaging around 6% monthly profit overall. I also increase my portfolio size. Motivation Level : 8/10 7) Consistency at Last Two years later, and I have traded several earnings cycles, done literally hundreds of my own trades, and I rarely take the official SO trades. Fills are not a problem, as I’m normally in the trade already, and I’m also trading stocks which are not on the SO list. Profits are decent, but I get some big losses, and the occasional losing month. I don’t like those, so I ramp-up the commitment. I decide to REALLY focus on this from 01-Jan-20. And then a dark-cloud-with-a-silver-lining comes along – COVID lockdowns. They suit me just fine: 7-8 hours a day – just me, the PC screen, charts, Excel sheets, Word documents detailing my ups/downs, cups of Earl Grey tea…..trade after trade. Total immersion. I love it. The wife has become a trading-widow. The cat is happy to be around me, cos I am no longer shouting. My profits rise to new levels, the March crash comes and goes without a dent to the bottom line. As we head towards the end of the year, I can finally say to myself that I have matured into a proficient SO trader – my risk management has improved enormously, my position sizing is as it should be, and my ability to distinguish between good/not-so-good trades has improved. I still screw up, but I keep a list of the mistakes I’ve made each month, and it’s satisfying to watch that list become smaller as the months roll on. I have finally found consistency – I’ve made a profit every single month this year. And my SO portfolio is far more profitable than my other ones. But the learning never stops – every week I read some post on the forum and think “Oh, wow, I didn’t think of that.” I’m no longer a SO member for the trades, but for the ideas and the discussions on the forum. They are gold. And I’ve learnt skills that I’ve been lacking for a long time – patience (no more “FOMO”), discipline (sticking to the rules, no doubling-down etc), no emotional trading (no revenge trades, not getting upset when a trade loses etc) The next stages are to get to grips with different trade types, like ratios. Motivation Level : 10/10 I’ve written this not with the view of “Hey, look at me”, but in the spirit of “If a dunce like me can become a competent trader, then anyone can”. If you’re a frustrated newbie, then rest assured that many of us have been there, many others are still in that place, but with determination and dedication, it’s possible to come out of the pain barrier, and see the sunshine on the other side. Happy trading.68 points
-
thought I share come of the web pages I use regularly. Maybe others can do the same. Options and volatility Option Strategy finder, all sorts of combos listed/explained http://www.theoptionsguide.com/option-trading-strategies.aspx Option Strategies and their greeks explained, interactive analysis http://www.888optionsnet.com/investigator_2/wi_strategyExplorer.asp?disclaimerread=true number of tools and data around (historical) IV http://www.ivolatility.com/home.j historical IV data http://www.optionistics.com/ probability calculator (I actually use that to quickly look up HV for a name) http://www.ivolatility.com/custom/pbc/ VIX Term Structure and historical VIX data http://vixcentral.com/ Options Screener (most active, higest Ivol and other) http://www.marketwatch.com/optionscenter/screener?screen=1&displaynum=100 VIX and more (blog, very educational if you want to learn more about VIX and VIX related ETN's (VXX etc) home page http://vixandmore.blogspot.co.uk 'best of' articles http://vixandmore.blogspot.co.uk/search/label/educational http://vixandmore.blogspot.co.uk/search/label/hall%20of%20fame http://vixandmore.blogspot.co.uk/2010/12/top-posts-of-2010.html earnings data and dates earnings data (earnings dates and historical moves) http://www.optionslam.com/ earnings calendars http://www.morningstar.com/earnings/earnings-calendar.aspx Market commentary and economic calendars Market commentary and free "Flash headline" alerts and paid for (directional) trading trading alerts (trend following) - I use the former http://www.stateofthemarkets.com/ economic data calendar (U.S.) http://www.marketwatch.com/economy-politics/calendars/economic economic data calendar (U.S. and international) http://global.econoday.com/byweek.asp?cust=global-premium FED Meeting calendars, statements, and minutes (2007-2013) http://www.federalreserve.gov/monetarypolicy/fomccalendars.htm charts and stock screeners Stock screener with ability to filter for loads of different fundamentals and other criteria http://www.finviz.com/screener.ashx stock charts pages http://stockcharts.com/ http://ycharts.com - can chart economic data (like jobless claims) and things like total return prices (incl. divs) for stocks and indices Tools/ Excel Addins Hoadley options Addin/tools, great Excel AddIn (windows only) with option pricer, Strategy evaluator and much more (good set of free tool, good value 'professional version') http://www.hoadley.net/options/options.htm Excel AddIn (I think also Windows only) to import all sorts of data (live and historical) from Yahoo Finance (free, you need to join Yahoo group though) http://finance.groups.yahoo.com/group/smf_addin/25 points
-
As many of you know, it has been a difficult period for me and my family. My wife had a second stroke last month and had to do a brain surgery last week to remove a brain stem cavernoma. I'm glad to report that the surgery went well, and she is now recovering in rehab. It is still a long process, but the most difficult and risky part is behind us. I would like to thank everyone for your support and good wishes! I'm very fortunate to have such great community, both on professional and personal level. The number of emails and messages was really overwhelming. Special thanks to our dedicated team of mentors (@Yowster @SBatch and others) for covering during my absence. I expect to be back in full force shortly and to continue providing the same level of support and service you are all used to. Happy Thanksgiving and happy trading during those challenging times!24 points
-
As I’ve done the past few years, I’ve broken down the Steady Options 2018 trade performance by trade type. Numbers were taken directly from the data in the Performance screen. Here’s are this year’s stats along with some comments from my perspective. Where applicable, I added totals from prior years for comparison... Pre-Earnings Calendars 40 Trades – 31 win, 9 loss (78% win) – Average Gain +9.61% 2017: 31 trades (84% win) – Average Gain +13.81% 2016: 44 trades (80% win) - Average Gain +15.07% 2015: 51 trades (80% win) – Average Gain +12.67% 2014: 48 trades (71% win) – Average Gain +13.80% 2013: 24 trades (88% win) – Average Gain +20.60% Comments: Average gain% down from prior years, largely because of 2 really big losers caused by large stock price movement away from calendar strike. Not really surprising given the bigger market swings this year. Without those big losers the average gain was right in line with prior years (we avoided big losers in prior years). Win rate comparable to prior years,. and very high. Pre-Earnings Straddles/Strangles 72 Trades - 60 win, 12 loss (83% win) – Average Gain +5.40% Breaking down further by hedged and non-hedged: Hedged – 49 win, 10 loss (83% win), average gain +4.66% Non-Hedged – 11 win, 2 loss (85% win), average gain +8.76% 2017: 77 trades (79% win) – Average Gain +5.02% 2016: 18 trades (72% win) – Average Gain +5.19% 2015: 44 trades (68% win) – Average Gain +2.61% 2014: 74 trades (62% win) – Average Gain +2.54% 2013: 104 trades (57% win) – Average Gain +1.35% Comments: Highest average gain percentage ever. Highest percentage of winning trades ever. Very low risk trades as it takes RV levels going much lower than prior cycles for these trades to be significant losers (only 4 of 72 trades had losses over -10%). Trade count down slightly from last year due to periods of elevated market volatility. These are riskier trades to open when IV is very high, as the risk for significant straddle price decline due to falling IV can really hurt trades. Index trades (RUT, SPX, TLT) 22 Trades – 19 win, 3 loss (86% win) – Average Gain +15.35%. 2017: 9 Trades (89% win) – Average Gain +19.72% 2016: 27 Trades (67% win) – Average Gain +3.01% Comments: RUT Broken Wing Condor: 3 win, 0 loss, average gain +10.00% SPX Butterfly: 7 win, 2 loss, average gain +17.08% TLT Butterfly: 9 win, 1 loss, average gain +15.41% Typically longer duration trades, can be open for 30+ days. Gain percentage down slightly from last year, due to 2 large losses. As with the calendars, this is not surprising given some of the bigger market swings. VIX-based trades 15 trades – 6 win, 9 loss (40% win) – Average Loss -10.89% 2017: 16 trades (75% win) – Average Gain +9.25% 2016: 16 trades (56% win) – Average Gain +1.34% Comments: Typical trade was for VIX to decline after spikes, but with larger and more sustained spikes this year there were many losing trades. Two 100% losses really hurt the overall average. Reverse Iron Condor (RIC) trades 7 trades – 7 win, 0 loss (100% win) – Average Gain +30.96% Comments: Started using the RIC trade later in the year during times when VIX was high (20+). Trades were designed to take advantage of larger price swings for stocks that was somewhat common during these elevated VIX times. When the stock prices moved, we saw some great gains. Going forward into January/February earnings cycles, will look to use RICs as alternative to straddles if VIX is still high – because although RICs hurt to IV decline, they are hurt by a lesser degree than straddles. However, downside of RICs compared to hedged straddles is that you need the stock price to move to make a profit. Other Trades 5 other trades than had an average loss of -5.35%. Nothing significant to note regarding them. Summary 2018 was unlike prior years for significant chunks of time. Prior years had low volatility and any VIX spike above 20 quickly reverted back down. 2018 had VIX near 20 for about 5 months of the year (7 months were much like prior years). Despite the increase in volatility, 78% of all SO trades were winners with an average gain of 7.07%. The biggest take away from this year is that certain trade types are better for certain market volatility conditions – hedged straddles and calendars are great to put on when volatility is low but they are riskier when volatility is elevated. When volatility is elevated, other trades like RICs and butterfly are less risky to put on during these times. SO is a great community, where members share ideas that benefit all of us and we all continue to learn more and more. Looking forward to continued success in 2019.22 points
-
Please welcome two new mentors @krisbeeand @rasar I'm sure most our members know those two members very well. They helped hundreds of members, are well respected in our community - we just making their status "official".21 points
-
As I’ve done the past few years, I’ve broken down the Steady Options 2017 trade performance by trade type. Here’s are this year’s stats along with some comments from my perspective. Where applicable, I added totals from prior years for comparison... Pre-Earnings Calendars 2017: 31 Trades – 26 win, 5 loss (84% win) – Average Gain +13.81% 2016: 44 trades (80% win) - Average Gain +15.07% 2015: 51 trades (80% win) – Average Gain +12.67% 2014: 48 trades (71% win) – Average Gain +13.80% 2013: 24 trades (88% win) – Average Gain +20.60% Comments: Again one of our best performing trade types, as it has been for multiple years. Number of trades down a bit from last year, seemed a bit tougher to find good entry prices overall this year. Win rate comparable to prior years, and very high. Pre-Earnings Straddles/Strangles 2017: 77 Trades - 61 win, 16 loss (79% win) – Average Gain +5.02% Breaking down further by hedged and non-hedged: Hedged – 28 win, 6 loss (82% win), average gain +6.01% Non-Hedged – 33 win, 10 loss (77% win), average gain +4.24% 2016: 18 trades (72% win) – Average Gain +5.19% 2015: 44 trades (68% win) – Average Gain +2.61% 2014: 74 trades (62% win) – Average Gain +2.54% 2013: 104 trades (57% win) – Average Gain +1.35% Comments: Trade count spiked up significantly this year as hedged straddle trades (beginning in 2nd half of year) gave a lot more trade opportunities. Highest percentage of winning trades ever. Very low risk trades as it takes RV levels going much lower than prior cycles for these trades to be significant losers (only 4 of 77 trades has losses over -10%). No reason to limit the number of these trades that you have on at the same time as big market upturns/downturns will help these trades but they can also be winners during normal market times. Initially, there was some fear that the short hedges may hurt overall performance but thankfully this was not the case as the win% and average gain were both higher than the non-hedged trades. Index trades (RUT, SPY, SPX, TLT) 9 Trades – 8 win, 1 loss (89% win) – Average Gain +19.72%. 2016: 27 Trades (67% win) – Average Gain +3.01% Comments: RUT Broken Wing Condor: 3 win, 1 loss, average gain +6.10% TLT Iron Butterflies: 5 win, 0 loss, average gain +30.62%. Great trade idea on this one. Kudos to @SBatch on this idea, I believe. Longer duration trades, typically open for 30-60 days. VIX-based trades 16 trades – 12 win, 4 loss (75% win) – Average Gain +9.25% Breaking down further by trades for contango and those playing for VIX spikes: Contango (VXX/SVXY) – 10 win, 0 loss (100% win), average gain +29.70% VIX spike – 2 win, 4 loss (33% win), average loss -24.83% 2016: 16 trades (56% win) – Average Gain +1.34% Comments: Those trades playing for the continued low volatility were some our best performing trades with 100% wins and average gain near +30%. Those trades playing for VIX spikes were our worst performers – low win% and average loss of near -25%. I view these trades primarily as portfolio hedges, so in that respect the losses are kind of acceptable to me. Other may not view these trades as hedges – but after multiple years of a flat/declining VIX will a small number of upward spikes (and spikes to VIX levels still below 20) saying we are due for a larger VIX spike and opening trades for it sounds foolish to me. I’m sure such a spike will happen at some point in time, but many people have lost a lot of money over the past few years playing for such a large and prolonged spike. Other Trades A few post-earnings Iron Condors on FB were both successful at around +30% gains. These trades played for stock price to stay relatively stable after earnings. I’d like to see more of these trades in the future as there appear to be quite a few stocks that have a tendency to stay calm after earnings. The one caveat being that we can’t go overboard and have too many of these open at the same time because large overall market moves can really hurt these trades (unlike straddle trades where such overall market moves will help).21 points
-
As has become my year-end tradition, I’ve broken down the Steady Options 2021 trade performance by trade type. Numbers were taken directly from the data in the Performance screen. Here’s are this year’s stats along with some comments from my perspective. Where applicable, I added totals from prior years for comparison. I should highlight up-front that 2021 saw SO’s highest ever yearly Compounded Annual Growth Rate (CAGR) of ~201%. It was a start to a return to a more “normal” market behavior – although VIX did have a few spikes into the 20’s and 30’s, it spent a large portion of the year below 20 which means we were able to do many of the SO standard bread and butter trades like calendars and straddles. Pre-Earnings Calendars 110 Trades – 87 win, 23 loss (79% win) – Average Gain +12.82% 2020: 33 trades (85% win) – Average Gain +21.97% 2019: 54 trades (65% win) – Average Gain +9.27% 2018: 40 trades (78% win) – Average Gain +9.61% 2017: 31 trades (84% win) – Average Gain +13.81% 2016: 44 trades (80% win) - Average Gain +15.07% 2015: 51 trades (80% win) – Average Gain +12.67% 2014: 48 trades (71% win) – Average Gain +13.80% 2013: 24 trades (88% win) – Average Gain +20.60% Comments: Highest ever number of calendar trades by a large margin at roughly twice the highest total of prior years. I attribute a large part of this increase to the RV analysis tools we now use all the time. Despite the higher number of trades, both win percentage and average gain per trade were on par with prior years - which means the calendars portion of the overall SO profit was very high this year. Straddles/Strangles (earnings and non-earnings) 129 Trades - 87 win, 40 loss, 2 break-even (68% win) – Average Gain +3.27% Breaking down further by hedged and non-hedged: Hedged – 27 win, 11 loss (71% win), average gain +2.11% Non-Hedged – 60 win, 29 loss, 2 break-even (67% win), average gain +3.75% 2020: 118 trades (67% win) – Average Gain +2.80% 2019: 106 trades (68% win) – Average Gain +3.58% 2018: 72 trades (83% win) – Average Gain +5.40% 2017: 77 trades (79% win) – Average Gain +5.02% 2016: 18 trades (72% win) – Average Gain +5.19% 2015: 44 trades (68% win) – Average Gain +2.61% 2014: 74 trades (62% win) – Average Gain +2.54% 2013: 104 trades (57% win) – Average Gain +1.35% Comments: Note that this data contains both earnings straddles and non-earnings hedged straddle (NEHS) trades. Highest ever number of straddle/strangle trades, up slightly from the number of trades during the last few years. Like calendars, RV analysis tools have helped identify more trades than before these tools were available. The straddle/strangle contribution to the overall SO profit was a yearly high. This is calculated as the number of trades multiplied by the average gain per trade. Hedged straddle average gain was hurt by several larger losses. Digging into these trades showed that they were all trades where we held the long straddles beyond the last short expiration and into earnings week, had the trades been closed on the day of the last short expiration losses would have been much lower. This will be a take-away for me going into 2022, when we have a losing trade as of the last short expiration, if I do hold the trade into earnings weeks I will add shorts to help protect against further RV decline. Very low risk trades as it takes RV levels going much lower than prior cycles for these trades to be significant losers Flys and Verticals 21 trades – 15 win, 6 loss (71% win) – Average Gain +4.81% Comments: New trade type, so no prior year comparisons. Directional, delta positive trades playing for stock price increase. Most trades were hedged. Used to replace call verticals as they handle falling RV better. Ratio Trades 9 trades – 3 win, 6 loss (33% win) – Average Loss -7.96% 2020: 10 trades (70% win) – Average Gain +2.50% 2019: 28 trades (64% win) – Average Gain +2.01% Comments: Poor performance caused by not having enough stock price rise scenarios, or having the gains on the rise offset by RV decline. For delta positive directional trades like this, we switched to unbalanced flys and call verticals, as they handle the scenario of stock price rising coupled with RV falling much better than the call ratios. Index trades (TLT, EEM, SPY, USO, EEM) No index trades this year: 2020: 19 trades (63% win) – Average Gain 9.54% 2019: 20 trades (60% win) – Average Loss -7.71% 2018: 22 trades (86% win) – Average Gain +15.35% 2017: 9 Trades (89% win) – Average Gain +19.72% 2016: 27 Trades (67% win) – Average Gain +3.01% Comments: We didn’t do index trades this year. Not sure if that’s a good thing or a bad thing. Other Trades Only one “other” trade this year. Summary 2021 Steady Options model portfolio gain is around +201% for the year, and as stated earlier it’s the highest yearly return we’ve ever had. While not everyone will be able to match this performance, the key takeaway is that the SO-style trades work – which means learning these trades and “making them your own” is well worth the effort. Again this year, I’d like to highlight and thank the SO community. We really have a bunch of very smart people who share their ideas and knowledge – this is what makes SO great. This year saw many new members make positive contributions to the community. Looking forward keeping things rolling in 2022! 2020 Year End Performance by Trade Type 2019 Year End Performance by Trade Type 2018 Year End Performance by trade type. 2017 Year End Performance by Trade Type 2016 Year End Performance by Trade Type 2015 Year End Performance by Trade Type20 points
-
Here is @cwelsh shares his experience of trading big volume in a fund: Open interest and volume, almost completely, are completely irrelevant. This has been the single biggest surprise. I have traded hundreds of contracts where I was the ONLY volume with zero issues. The bigger deal is the spread. If there is a two cent spread, I typically can get my order easily filled. If there's a $4.00 spread (e.g. PCLN), I get creamed. The PCLN trade took HOURS to get filled, and was filled 1-2 contracts at a time, sometimes as many as 5. Getting out was a nightmare and I had to leg out individually at bad prices. By and large now I'm planning on avoiding the big spreads. That's unfortunate because those spreads allow smaller traders (5 contracts or less) to snipe away and get great fills; Option pricing systems are NOT efficient or fair. There is no "queue." In other words if I put an order in for 100 contracts of the $50 straddle on stock ABC at $1.00 and five minutes later you do the same thing at $1.00 you might get filled first. There is no FIFO or LIFO system. This means its also possible that I have an order for $1.00 and you do for $0.99 and the price moves and you get a fill but I don't -- even though I offered more. This happens on HIGH volume options because there essentially is just a screen the market makers look at, and if my order is buried, they can miss it. I have seen this happen when I had multiple orders in trying to push the price down. E.g. I wanted a $1.00 fill for 900 contracts, so I put in orders at $1.00 at $0.99 and $0.98 -- for 900 contracts each (with a cancel order in for as soon as I get 100 contracts filled). My theory was to drive the price down, or make it look like there was demand to push the price down so I could get the strike I wanted. Imagine my surprise when the $0.99 got filled, but not the $1.00. This also means it makes sense on higher volume stocks to "refresh" your order by resubmitting it. There have been dozens of times I've had an order sitting for an hour, I cancel and replace and its instantly filled at the same price. "Smart" routing is sometimes not that smart too. This is because when I submit my $1.00 order, it might be routed to the CBOE because CBOE has the best price at $1.03 currently. But over the next five minutes another exchange might become the best priced one -- my order won't necessarily be moved to the better exchange because it's already on one. Another reason to resubmit. Lastly, Smart routing, DESPITE what you've been told, does not cross exchange map. In other words, if you have an order for $1.00 on a straddle and there is one exchange that has the put for $0.50 and the call for $0.51 and a separate exchange that has the put for $0.51 and the call for $0.50, the software will NOT split your order between the two exchanges so as to pick off the better priced option off each. This is another reason you can have a straddle priced at the natural price, but not get a fill -- the natural price is not from one exchange, rather multiples.19 points
-
So.. it's the end of the month, time for a decision. Since this is our first award, we have to take into account contribution of the last few months, not only one month. And this time it will be not one member but three.. surprise surprise.. The award goes to The Three Musketeers ( @gf58, @TrustyJules, @FrankTheTank) Thank you for your contributions, we all appreciate it very much!!18 points
-
As I’ve done the past few years, I’ve broken down the Steady Options 2019 trade performance by trade type. Numbers were taken directly from the data in the Performance screen. Here’s are this year’s stats along with some comments from my perspective. Where applicable, I added totals from prior years for comparison... Pre-Earnings Calendars 54 Trades – 35 win, 19 loss (65% win) – Average Gain +9.27% 2018: 40 trades (78% win) – Average Gain +9.61% 2017: 31 trades (84% win) – Average Gain +13.81% 2016: 44 trades (80% win) - Average Gain +15.07% 2015: 51 trades (80% win) – Average Gain +12.67% 2014: 48 trades (71% win) – Average Gain +13.80% 2013: 24 trades (88% win) – Average Gain +20.60% Comments: We had both our largest number of calendar trades and the lowest percentage of winning trades, but still good as we had right around 2 winners for every 1 loser. Market had quite a few VIX spikes with corresponding larger stock price movements. This led to our overall win/loss percentage to be lower as there were a number of trades where the stock price moved too much. Contribution was very positive on overall portfolio performance. Pre-Earnings Straddles/Strangles 106 Trades - 72 win, 34 loss (68% win) – Average Gain +3.58% Breaking down further by hedged and non-hedged: Hedged – 37 win, 15 loss (71% win), average gain +4.41% Non-Hedged – 35 win, 19 loss (65% win), average gain +2.78% 2018: 72 trades (83% win) – Average Gain +5.40% 2017: 77 trades (79% win) – Average Gain +5.02% 2016: 18 trades (72% win) – Average Gain +5.19% 2015: 44 trades (68% win) – Average Gain +2.61% 2014: 74 trades (62% win) – Average Gain +2.54% 2013: 104 trades (57% win) – Average Gain +1.35% Comments: Its a little apples vs oranges when we compare the non-hedged straddles. This year we did a lot of short-term straddle trades over the last few days prior to earnings (tools such as VolatilityHQ and ChartAffair have made the analysis of this type of trade much easier). So, the lower average gain percentage is ok given that most of the short-term straddle were only open for 1-3 days. Hedged straddle winning percentage and average gain were down a bit from prior couple of years. I believe this was caused by middling VIX levels during the year, time periods where the VIX was neither too high to avoid entering trades nor too low to have minimal risk of larger than normal RV decline due to VIX dropping for hedged straddles held open for multiple weeks. Very low risk trades as it takes RV levels going much lower than prior cycles for these trades to be significant losers. I am not surprised that the average gain for all straddles (hedged and non-hedged) is lower, as this is a result of short-term straddle trades held open for only a few days. The positive aspect of this is we were able to open more trades, so when you multiply the average gain x number of trades the positive contribution to the overall portfolio performance was good and in line with prior years. Index trades (SPX, TLT, EEM, XLV) 20 Trades – 12 win, 8 loss (60% win) – Average Loss -7.71%. 2018: 22 trades (86% win) – Average Gain +15.35% 2017: 9 Trades (89% win) – Average Gain +19.72% 2016: 27 Trades (67% win) – Average Gain +3.01% Comments: 4 big losing trades SPX (-100%, -100%, -72.9%) and TLT (-100%) killed the performance of these trades this year. Typically longer duration trades, can be open for 30+ days. Most of these trades were half-allocations, but even at that level the large losing trades have a big impact on the overall portfolio performance. VIX-based trades 3 trades – 0 win, 3 loss (0% win) – Average Loss –66.43% 2018: 14 trades (40% win) – Average Loss -10.89% 2017: 16 trades (75% win) – Average Gain +9.25% 2016: 16 trades (56% win) – Average Gain +1.34% Comments: 3 losing trades which play for VIX to fall from highs, or looking for movement in either direction all failed. Going forward, we will not be using VIX-based trades as these types of trades are in the PureVolatility portfolio. Reverse Iron Condor (RIC) trades 13 trades – 8 win, 5 loss (62% win) – Average Loss -4.39% 2018: 7 trades (100% win) – Average Gain +30.96% Comments: RICs did great in late 2018 when VIX stayed above 20. We used them in the early part of 2019, but as VIX fell back below 20 we had some outsized losses which resulted in an overall small loss per trade despite having more winnings trades than losing trades. RICs are trades that we may use in the future when the VIX gets very high, but we are unlikely to use them in other timeframes. Ratio Trades 28 trades – 18 win, 10 loss (64% win) – Average Gain +2.01% Comments: New trades for this year, based on TrustyJules research and trades. Similar to straddles in that straddle RV is an important aspect of trade performance, but unlike straddles in that the trade looks for stock price movement in one particular direction (almost all trades used calls to look for stock price to go up). A few mid-sized losers lowered average gain%, as larger than normal RV declines caused the trades to lose more than what was expected. Broken-wing Butterfly (BWB) Trades 8 trades – 6 win, 2 loss (75% win) – Average Loss -5.20% Comments: One big -96% losing trade exceeded the gains from all winning trades. Risk/reward is about equal with these trades, but the caveat is that to hit the really big gains you need to hold until expiration day and have the stock price in a tight zone. Conversely, bigger losses can accumulate quicker on stock movement. Given the current trade allocations, will likely avoid these trades in the future to limit risk Summary 2019 Steady Options model portfolio is likely to be around +40% for the year, which is very good for a stock or fund performance in general, but well below the typical SO level. When you dig into the above numbers you see that the overall contribution from our “bread and butter” calendars and straddle trades is on par with prior years (multiply avg gain per trade by number of trades). We had some very large losing trades, and of the top 10 losers only one was from the calendar or straddle trades (and it was at #10). Take away those 10 biggest losers and the model portfolio gain gets to almost +90%. Going forward, a goal is to avoid those bigger losses – here are a few ideas along those lines: Of the -100% losers (or close to it), we see SPX/TLT/VXX butterflies and the stock-specific MMM butterfly. These trades can have very big gains, or very big losses – and the losses can accrue fairly quickly on significant stock price moves in the wrong direction. Even at half allocation, these big losses can have a large negative impact on the overall portfolio performance. However, their potential large gains can be enticing. An idea here is to create a quarter allocation trade, where occasional outsized losses would not be a devastating – and the occasional huge gains would still have a positive impact. Closing early at loss levels is another possibility here, but a large gap in stock price movement in the wrong direction could still lead to a large percentage loss. RICs have 3 of the top 10 biggest losers, they suffered during the timeframe early in the year when market volatility was coming down from highs at the end of 2018 into early 2019. RICs offer great risk/reward setup where 100%+ gains are very possible, but so are big losers. RICs would also be best served by a quarter allocation trade size. In summary, our bread and butter calendar and straddle trades have been consistent performers over the years, and this year too. We have lots of experience with them and tools available to quickly analyze trades (longer term SO members remember back a few years where analysis for these trades was not nearly as easy). So, stick with what has consistently worked. We should be more careful with some of the other trade types, particularly those where bigger percentage gains and losses are possible. As always SO is a great community, where members sharing their ideas and experiences allow us all to learn. Looking forward to a successful 2020. 2018 Year End Performance by trade type. 2017 Year End Performance by Trade Type 2016 Year End Performance by Trade Type 2015 Year End Performance by Trade Type18 points
-
As I do at the end of each year, I’ve broken down the Steady Options 2025 trade performance by trade type. Numbers were taken directly from the data in the Performance screen (plus some recently closed trades). Here’s are this year’s stats along with some comments from my perspective. Where applicable, I added totals from prior years for comparison. Unfortunately, 2025 was Steady Options worst performing year. I’ll try to present what I believe to be the main reasons for this as they apply to each type of trade. From an overall perspective, here are some key points that I believe factored into the performance: Most SO trades are Vega positive trades leading up to earnings events, so volatility plays a key role in the outcome of our trades. Volatility rising helps trades and volatility declining hurts trades. 2025 saw 4 VIX spikes that occurred rather quickly (not a gradual rise), most spikes were relatively short in duration with declines starting shortly after the spikes. When you look at the year in total, the vast majority of the time we were in time periods where volatility was falling. Trades that were in place prior to the spike performed well, but other trades that did not encompass a spike commonly dealt with falling volatility and RV declines bigger than prior earnings cycles. This meant that trade that would have been small to moderate gains in prior years turned into small to moderate losses this year. Losses above 10% were also more common. There were some things that worked very well this year, although they were in some of the portfolios outside of SO. Steady Yields (SY) and Simple Spreads (SS) performed very well as many of their trades were helped by the same things that hurt the SO trades. Most trades in SY and SS tended to be Vega negative, meaning that they were helped by declining IV – so both time decay and declining IV helped these trades. Pre-Earnings Calendars 24 Trades – 21 win, 3 loss (88% win) – Average Gain +8.77% 2024: 65 trades (81% win) – Average Gain +12.13% 2023: 65 trades (85% win) – Average Gain +9.56% 2022: 11 trades (64% win) – Average Loss -9.55% 2021: 110 trades (79% win) – Average Gain +12.82% 2020: 33 trades (85% win) – Average Gain +21.97% 2019: 54 trades (65% win) – Average Gain +9.27% 2018: 40 trades (78% win) – Average Gain +9.61% 2017: 31 trades (84% win) – Average Gain +13.81% 2016: 44 trades (80% win) - Average Gain +15.07% 2015: 51 trades (80% win) – Average Gain +12.67% 2014: 48 trades (71% win) – Average Gain +13.80% 2013: 24 trades (88% win) – Average Gain +20.60% Comments: Overall winning percentage was at the high end compared to prior years, but average gain per trade was at the lower end. This year lacked some larger gains that we got in prior years (likely due to volatility declines). Number of trades was much lower than most prior years as this year saw the calendars for many stocks having their calendar RV significantly higher than prior cycles, and therefore trades were not opened in these cases. There was a learning here to take forward into next year. For calendar trades entry we look to enter at lower RV levels and/or on stocks that show a pattern of rising calendar RV heading into T-0. Many stocks show a tendency for calendar RV to rise regardless of current levels, but we didn’t open trades on these stocks if the current RV was elevated. While we wouldn’t want to enter if calendar RV was sky high, hindsight showed that opening trades when RV was slightly to moderately elevated wound up being winners. Earnings calendars continue to be a core SO strategy. Straddles/Strangles 42 Trades - 21 win, 20 loss, 1 break-even (51% win) – Average Loss -0.56% Breaking down further by hedged and non-hedged: Non-Hedged – 21 win, 17 loss, 1 break-even (55% win), average gain +0.24% Hedged – 0 win, 3 loss (0% win), average loss -10.97% 2024: 57 trades (73% win) – Average Gain +4.72% 2023: 166 trades (64% win) – Average Gain +1.65% 2022: 148 trades (71% win) – Average Gain +4.89% 2021: 129 trades (68% win) – Average Gain +3.27% 2020: 118 trades (67% win) – Average Gain +2.80% 2019: 106 trades (68% win) – Average Gain +3.58% 2018: 72 trades (83% win) – Average Gain +5.40% 2017: 77 trades (79% win) – Average Gain +5.02% 2016: 18 trades (72% win) – Average Gain +5.19% 2015: 44 trades (68% win) – Average Gain +2.61% 2014: 74 trades (62% win) – Average Gain +2.54% 2013: 104 trades (57% win) – Average Gain +1.35% Comments: Lower number of straddle/strangle trades compared to prior years, due primarily to double diagonal (DD) trades which have similar gain targets to straddles and strangles but can be kept open longer. Overall winning percentage and average gain per trade were at lows. This is primarily due to the decline volatility which saw straddle RV dropping by larger percentage compared to cycles in prior years. When the stock price did moves, gains were often muted when factoring in the larger RV declines. From a downside risk perspective, we saw more losses above 10% compared to prior years with 7 of the 20 losing trades having a loss greater than 10%. 12% of trades hit 10% gain target, which is lower compared to prior years. These trades remain low risk trades as it takes RV dropping much more than their prior cycle tendencies to be significant losers – unfortunately we saw more cases of the outsized RV drops this year. Double Diagonals DD trades have the goal of having performance similar to straddles/strangles – but have the ability for the trades to be open for much longer periods of time (up to 3 weeks prior to earnings) giving the stock more time to move but still have minimal downside risk. 48 Trades - 28 win, 19 loss (60% win) – Average Gain +0.79% 2024: 52 trades (73% win) – Average Gain +4.86% Comments: Winning percentage was down from last year and average gain per trade was only slightly positive. Again, a result of RV declines more than prior years. What were small winners last year because small losers this year. Last year, all losing trades were under 10% losses (majority of losses were under 5%). This year we saw 6 losses above 10%, but all losses were under 20%. The DD trade is a low risk trade type with minimal downside risk, but this year has shown that when RV declines are more than expected then losses in the 10%-15% range can occur if the stock price doesn’t move. 25% of trades hit 10% gain target (compared to 35% last year). This is not a huge difference, it means that when the stock price moves you can hit that 10% gain target regardless of what happens with RV. Pre-earnings Iron Condors In the 4th quarter we introduced the pre-earnings Iron Condor (IC) trade as a way to get a Vega negative trade type into the SO mix of trades. We targeted stocks that have a consistent and large straddle RV decline heading into earnings whose historical straddle performance show mostly losing trades (meaning the stock price doesn’t tend to move a lot prior to earnings). 10 Trades - 7 win, 3 loss (60% win) – Average Gain +0.07% Comments: Large percentage of winning trades, but one of the three losing trades was an oversized loss when stock price made a big move corresponding to a larger market downturn. Will continue with these trades in the future, trying to limit those bigger losing trades by keeping risk vs reward near equal and by selecting stocks whose straddle RV decline is both large/consistent and happens in a relatively short period of time. Other Trades Non-Earnings RICs: 2 win, 1 loss (67% win) – Average Gain +0.00%. These non-earnings trades have higher downside risk if stock price doesn’t move. In this case the 1 loss equaled the 2 wins. Hedged ratios and BWBs: 2 win, 3 loss (40% win) – Average Loss -10.90%. These were hedged directional trades, the losses were larger when the stock price didn’t move in the right direction. S&P500 addition date trade: 1 win, 2 loss (33% win) – Average Loss -14.50%. These trades play for stock price decline (or at least staying flat) after the S&P500 addition. The pattern of prior year additions was broken this year. Several of the additions this year had much less lead time compared to prior years, so this might be a factor. Summary 2025 was a very challenging year for the Steady Options model portfolio. We used the same types of trade setups and analysis that has worked for us year after year. However, the market behavior this year yielded underperforming trade results. Going forward, we will continue to try to optimize trades and limit losses – but one underperforming year does not mean we need to re-think every type of trade as they have performed consistently well in prior years As always, I’d like to highlight and thank the SO community. We continue to have a group of very smart people that seems to grow each year who share their ideas and knowledge – this is what makes SO great. Looking forward to a better 2026.17 points
-
As has become my end of year tradition, I’ve broken down the Steady Options 2022 trade performance by trade type. Numbers were taken directly from the data in the Performance screen. Here’s are this year’s stats along with some comments from my perspective. Where applicable, I added totals from prior years for comparison. While 2021 appeared to be the start of a return to a more normal market behavior, volatility was back again in 2022 with the VIX staying above 20 for almost the entire year. This meant RV’s for both calendars and straddles were elevated, so the year was dominated by shorter-term straddle trades as a way to keep downside risk lower, very few calendars and a new combo trade using indexes such as SPY and QQQ. Pre-Earnings Calendars 11 Trades – 7 win, 4 loss (64% win) – Average Loss -9.55% 2021: 110 trades (79% win) – Average Gain +12.82% 2020: 33 trades (85% win) – Average Gain +21.97% 2019: 54 trades (65% win) – Average Gain +9.27% 2018: 40 trades (78% win) – Average Gain +9.61% 2017: 31 trades (84% win) – Average Gain +13.81% 2016: 44 trades (80% win) - Average Gain +15.07% 2015: 51 trades (80% win) – Average Gain +12.67% 2014: 48 trades (71% win) – Average Gain +13.80% 2013: 24 trades (88% win) – Average Gain +20.60% Comments: Lowest number of calendar trades we’ve had since we started using the strategy. This is due to much higher RV levels and stocks moving more with the higher market volatility. Although there were more winning trades than losing trades, several outsized losses caused the combined return to be negative. This is still a core SO strategy, and we’ll do more of them once market volatility returns to more normal levels. Straddles/Strangles 148 Trades - 103 win, 40 loss, 5 break-even (71% win) – Average Gain +4.89% Breaking down further by hedged and non-hedged: Non-Hedged – 97 win, 36 loss, 5 break-even (72% win), average gain +5.24% Hedged – 6 win, 4 loss (60% win), average gain +0.14% 2021: 129 trades (68% win) – Average Gain +3.27% 2020: 118 trades (67% win) – Average Gain +2.80% 2019: 106 trades (68% win) – Average Gain +3.58% 2018: 72 trades (83% win) – Average Gain +5.40% 2017: 77 trades (79% win) – Average Gain +5.02% 2016: 18 trades (72% win) – Average Gain +5.19% 2015: 44 trades (68% win) – Average Gain +2.61% 2014: 74 trades (62% win) – Average Gain +2.54% 2013: 104 trades (57% win) – Average Gain +1.35% Comments: Highest ever number of straddle/strangle trades. The vast majority of these trades were short-term, one or two day straddles or tight strangles using stocks identified by RV charting tools as being good candidates. The short-term trades were used with the goal of keeping downside risk lower – and this is exactly what happened as only 8 of the 148 trades had losses above 10% (and none more than 15%). On the winning side, 50 trades had gains above 10%. Both the win rate and average gain per trade were very good given the short durations of most trades. Only a few hedged straddles were used this year. Since RV was higher, we wanted to avoid giving trades more time for RV to decline. Very low risk trades as it takes RV dropping much more than their prior cycle tendencies to be significant losers. Index trades (SPY, QQQ, IWM) 50 Trades - 37 win, 13 loss (74% win) – Average Gain +2.07% Breaking down further: Combo New (Friday/NextFriday) – 9 win, 1 loss (90% win), Avg gain +5.24% Combo Old (Friday/Monday) – 24 win, 9 loss (73% win), Avg gain +2.07% Friday Flys – 4 win, 3 loss (57% win), Avg Loss -3.19% 2021: None 2020: 19 trades (63% win) – Average Gain 9.54% 2019: 20 trades (60% win) – Average Loss -7.71% 2018: 22 trades (86% win) – Average Gain +15.35% 2017: 9 Trades (89% win) – Average Gain +19.72% 2016: 27 Trades (67% win) – Average Gain +3.01% Comments: We started using a combo trade on indexes, initially a 5-leg trade held for 3-5 days using Friday/Monday expirations. Trade initially performed well, but when market volatility started dropping we saw losses above 10% becoming too common. So, we then began to use a new combo setup, a 4-leg trade held for 3-5 using Friday/NextFriday expirations. The goal was to keep losses smaller because having the long expiration a week after the shorts would allow it to retain more of its value. To date, it has played out that way with only 1 smaller losing trade out of 10 (compared to 6 losses above 10% of the 33 trades using the Friday/Monday expiration). We plan on continuing to use the Friday/NextFriday combo going forward. The Friday Flys were designed to be opened and closed on the same day. They back-tested very well, but turned out to be volatile to manage so we stopped using them. Other Trades A handful of some miscellaneous trades, most of which turned out to be losing trades. Summary 2022 Steady Options model portfolio was up around +90% for the year. This result was below some years, but note that we didn’t use calendar trades this year due to the volatile market climate – and calendars have historically always been our highest average gain per trade. Going with mostly lower risk, short-term straddles and tight strangles kept us away from trades with bigger losses, but also kept us away from trades with larger gains – so that 90% yearly gain is good based on the more conservative trades we primarily used this year. As always, I’d like to highlight and thank the SO community. We continue to have a group of very smart people that seems to grow each year who share their ideas and knowledge – this is what makes SO great. Looking forward to 2023. 2021 Year End Performance by Trade Type 2020 Year End Performance by Trade Type 2019 Year End Performance by Trade Type 2018 Year End Performance by trade type. 2017 Year End Performance by Trade Type 2016 Year End Performance by Trade Type 2015 Year End Performance by Trade Type17 points
-
As I’ve done the past few years, I’ve broken down the Steady Options 2020 trade performance by trade type. Numbers were taken directly from the data in the Performance screen. Here’s are this year’s stats along with some comments from my perspective. Where applicable, I added totals from prior years for comparison... A note on prior year comparisons. 2020 was a year unlike any other in recent history so any comparison to other years will certainly have an apples vs oranges aspect to it – prior to 2020 we went through 8 years where the VIX barely got above 20, and when it did it only stayed there for a few days at most, this year we’ve had VIX above 20 for ~10 months straight with some historic highs as well. Pre-Earnings Calendars 33 Trades – 28 win, 5 loss (85% win) – Average Gain +21.97% 2019: 54 trades (65% win) – Average Gain +9.27% 2018: 40 trades (78% win) – Average Gain +9.61% 2017: 31 trades (84% win) – Average Gain +13.81% 2016: 44 trades (80% win) - Average Gain +15.07% 2015: 51 trades (80% win) – Average Gain +12.67% 2014: 48 trades (71% win) – Average Gain +13.80% 2013: 24 trades (88% win) – Average Gain +20.60% Comments: Lower number of trades this year, as high market volatility made finding good entry levels difficult (25 of 33 trades were made in the first 2 months of the year before Covid hit). The trades we did make had a very high win/loss percentage and the highest average gain we’ve had since we started using these trades. Contribution was very positive on overall portfolio performance. Straddles/Strangles (earnings and non-earnings) 118 Trades - 76 win, 42 loss (64% win) – Average Gain +2.80% Breaking down further by hedged and non-hedged: Hedged – 48 win, 24 loss (67% win), average gain +2.68% Non-Hedged – 28 win, 18 loss (61% win), average gain +2.99% 2019: 106 trades (68% win) – Average Gain +3.58% 2018: 72 trades (83% win) – Average Gain +5.40% 2017: 77 trades (79% win) – Average Gain +5.02% 2016: 18 trades (72% win) – Average Gain +5.19% 2015: 44 trades (68% win) – Average Gain +2.61% 2014: 74 trades (62% win) – Average Gain +2.54% 2013: 104 trades (57% win) – Average Gain +1.35% Comments: We did a lot of non-earnings hedged straddle (NEHS) trades this year during periods of elevated volatility, but to separate those will require a deeper dive into the data. So, for now, this data has all straddle trades grouped together, both earnings and non-earnings. It's safe to say that the NEHS trades had both bigger winners and bigger losers. Hedged straddle winning percentage was a tiny bit lower than prior years, but average gain per trade was down a bit more. Given the large volatility swings this year, I think we had some larger than normal losing trades when volatility dropped more than anticipated – part of trading in a year like this. Very low risk trades as it takes RV levels going much lower than prior cycles for these trades to be significant losers – although we did see a few of those this year. I am not surprised that the average gain for all straddles (hedged and non-hedged) is lower, as this is a result of short-term straddle trades held open for only a few days. The positive aspect of this is we were able to open more trades, so when you multiply the average gain x number of trades the positive contribution to the overall portfolio performance was good and in line with prior years. Index trades (TLT, EEM, SPY, UNG, USO, EEM) 19 Trades – 12 win, 7 loss (63% win) – Average Gain 9.54%. 2019: 20 trades (60% win) – Average Loss -7.71% 2018: 22 trades (86% win) – Average Gain +15.35% 2017: 9 Trades (89% win) – Average Gain +19.72% 2016: 27 Trades (67% win) – Average Gain +3.01% Comments: Longer duration trade with many big winners and big losers, many more big winners than big losers so average gain was very good. Reverse Iron Condor (RIC) trades 6 trades – 4 win, 2 loss (67% win) – Average Loss -5.17% 2019: 13 trades (62% win) – Average Loss -4.39% 2018: 7 trades (100% win) – Average Gain +30.96% Comments: One big loser offset the winners. Switched to NEHS setups instead of RIC trades, as downside risk is lower with NEHS setup. Ratio Trades 10 trades – 7 win, 3 loss (70% win) – Average Gain +2.50% 2019: 28 trades (64% win) – Average Gain +2.01% Comments: Trade count was lower, due to not finding good entry levels with elevated volatility for much of the year. We’d like to do more of these in 2021, especially for stocks who have stock rising tendencies into earnings. We’ve learned a lot about different hedging scenarios as we’ve done more of these trade. Other Trades 7 other trades than had an average loss of -8.46%. Nothing significant to note regarding them. Summary 2020 Steady Options model portfolio is likely to be around +120% for the year, so a very good return. Key to this was avoiding any big losing months, which was a significant accomplishment given the huge market swings this year. This year was one when our traditional bread & butter trades were not possible for a larger percentage of the year due to the very high market volatility. We adapted the best we could and avoided entering trades just for the sake of entering them. We had some bigger winners and bigger losers compared to prior years – but that is to be expected given the volatility. I hope 2021 returns to more normal market behavior where we can get back to our standard trades. I’d like to highlight and thank the SO community. We really have a bunch of very smart people who share their ideas and knowledge – this is what makes SO great. This year saw the development and enhancement of many different trade analysis tools put together by members and shared with the community. These things really do have a big impact on making trade analysis easier. Looking forward to a great, and hopefully more normal, 2021 2019 Year End Performance by Trade Type 2018 Year End Performance by trade type. 2017 Year End Performance by Trade Type 2016 Year End Performance by Trade Type 2015 Year End Performance by Trade Type16 points
-
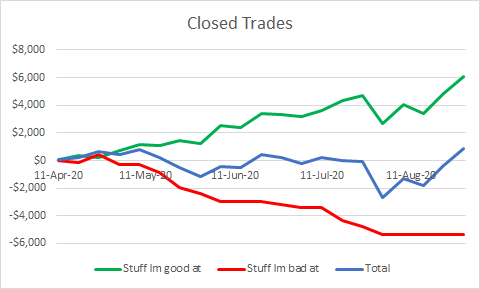
With the month virtually over I thought I'd give an update of my results since I stopped doing the stuff Im bad at (8 Aug to today): 7.8% return on capital including commissions 27 trades with 77.8% win rate Worst loss of 27.3% and best return of 30.2% with an average of 6.8% My trades consisted of most of the official trades along with a number of unofficial trades/strategies that I've learnt directly from the SO forum/members. The official trades that I missed were usually good ones (like BILI) and I whiffed a number of otherwise good ones (BBY was a 1.2% return after I hit BUY rather than sell and had to quickly unwind that mess). Id put the total result down to a combination of focus and luck. Focus in that I used my results to tell me what I seemed to do well and what I wasnt getting the hang of...then eliminating what wasnt working and focusing single mindedly on getting good at the one or two strategies I continued to trade. I cant emphasise strongly enough the benefits I got from just focusing on one thing at a time and relentlessly focusing on improving at it. Luck in that the outcome of each trade is random..so its kind of illogical to think that one or two trades is going to be consistently profitable...but applying the law of large numbers to a strategy with an established edge -ie do it a lot- and the numbers work out in your favour. Its been mentioned that an important step in the learning is putting on your own trades. Through having to identify my own potential stocks, identify my entry points, plan and execute my own exits countless times....well....the learning multiplies. One other thought: trading is the most honest task Ive ever experienced. There is no room for delusion, bias, negativity, optimism, excuses or blame. It demands total honesty of the self. Ive worked in jobs where the majority of the role involved wearing a suit, being likable and appearing to know what was going on...actually generating money for shareholders was an optional extra and could be frowned upon if done in a way that made others feel inadequate...ie most of the job was playing 'dress ups' as a busy business men in business. Trading couldnt be further from it. If you make a profit; thats on you. If you make a loss; thats on you. If you waste time not focusing on how to make a profit; thats on you. So without being provocative -and with the non-existant authority of someone who had a couple of lucky weeks in a row and still has too much to learn- if you're not making money then it stands to reason that its your fault. Putting aside the emotion this statement would conjure up in any human with a pulse, the correct response is to ask yourself what can I do to improve. I dont know if the discussion has moved on or not but I unfollowed the thread when there was a lot of finger pointing about commissions and impossible fills...it was bumming me out and screwing with my mental. The only thing that matters is how each of us can improve; blame is a waste of time. My biggest loss this month was on a low open interest CIEN ratio where the MMs immediately jacked the IV after I entered; the previous me would have bitched and moaned about how it was rigged or unfair. The me that's developed during my time with SO instinctively thought that sucked...how do I reduce the risk of it happening again in future. So I pulled some data, identified some micro structure behaviour, got a sense of where the punji traps were and adjusted my approach. Im still nervous as hell about it happening again and Ive by no means gotten to the bottom of it but the adjustments in my approach allowed me to close out a position today for a overnight gain of 16% all off the back of RV change in a low liquidity/wide spread market. I wouldnt have been able to do that had I not been punched in the face a week earlier and resolve to minimise its future frequency. Iago said whats done is done and John Galt said what is, is but a less esoteric boss once told me that its not how many times you get knocked down that counts, its how many times you get back up. As this last point is becoming a bit abstract but I'll try to bring it down to earth by summarising that a critical part of trading seems to be having an appropriate mentality; specifically one of complete honesty, resilience and self ownership of all outcomes good or bad. If you feel the urge to blame then youre probably on the wrong track. If you feel the urge to find a way to avoid that happening again then youre on a more profitable course. What that one improvement is going to be different for everyone but look at your trading log -you have been keeping one havent you?-, pick only one thing that will make a difference and ignore everything else until you've improved it.
 15 points
 -
Thank you @Yowster for the excellent summary! To put things in perspective, we had 215 trades in 2022, lower than our long term average, and average holding period was just 3 days, due to higher IV and higher risk. It means that we utilized only around 20-30% of the portfolio on average, with the rest in cash. 90% return that we reported was on the whole portfolio - if we reported return on invested capital (like other services do), we would be reporting over 300% return. Thank you again to everyone for their support, and of course special thanks to our contributors @Yowster @krisbee @cwelsh @Jesse and @SBatch We would like to wish everyone Happy Holidays, Happy New Year and healthy and prosperous 2023!13 points
-
Well thank you all for the kind words - I shall do my best to be helpful. I see @craigsmith posted some of his background. First of all I am Dutch, I live in Belgium, I have a French education and grew up in Brazil and in my professional life not a small part of my clients are American. I have been investing since very early days as my parents encouraged me to manage the small portfolio of stocks I inherited as far back as when I was 15. For those unaware of this bit of history the first options exchange in Europe was opened in Amsterdam under the then name European Options Exchange shamelessly copying much of the good work of the CBOE. I got quite interested in this and my first trade involved the purchase of a LEAP on the Amsterdam index and writing short options against it. LEAPS were (and are) undervalued compared to shorter term options and the thought was to recover the full purchase price and then some over the course of the process. This was in 1980ies in a bull period and I found rather sooner than later that the cash lay-out required to buy-back the short option and sell a higher option eliminated my liquidity rather more quickly than I expected. Selling deep ITM shorter options would not give the necessary return so my first trade was a (modest fortunately!) bust. I read more on options - but frankly for a long while I found all the so called strategies to be unsatisfactory as they were to my mind all variants of a long (or short/neutral) punt. Nothing wrong with those but to my mind it didnt make use of what options offered in terms of mechanism. Certainly I wasnt doing this full time and with the usual job, wife, children, house obligations I lacked resources for trading anyhow. In the meanwhile I managed a family trust but that did not lend itself to options trading. I came back to serious options trading when I had more capital and time to devote to it. Like most on here I looked a long time in both books and OL resources finding absolutely nothing that told me something new - its all very well to know about butterflies or condors - what you need is something where as the small guy you can make use of things that larger parties cannot adequately make use of. A few years ago I came across Jeff Augen's books which were quite an eye opener - for the first time it gelled in my mind how to use that odd derived value volatility for something more interesting than just option (mis) pricing. Looking into volatility traders turned out to be an (initial) disappointment - they certainly talked very complicated language but I got the distinct impression that most were types that claim to have a winning strategy to play Baccarat, just gamblers with a big mouth. Through SeekingAlpha and another site I came across SO and was immediately interested - however i had been disappointed before so for a long while I watched from afar and read the many publicly available articles on SO. Then there was a rather nasty public spat in which Kim got drawn in by a disagreeable fellow on the other site - Kim's responses impressed me by their cool and reasonable manner. This gave a whole new credibility to the 'claims' on the SO site and I decided to join, so whilst its true that I have been here less than a year - I lurked for a long while before. What I picked up on SO has really helped me and i am now trading very frequently and much more structurally successful - the CA part of the offering was new to me but after paper trading in a first stage, I have been diligently following on here ever since. SO made me trade better and hopefully I can assist some of you to get better too.13 points
-
I'm asked many times how I choose between Straddle, strangle or RIC for my pre-earnings plays. It's always a balance between risk/reward. As we know, those trades are supposed to be sold before earnings. They benefit from IV jump and/or price movement. The biggest (and basically the only) enemy is the negative theta. When buying a strangle, we are buying calls and puts with different strikes. The strangle will have the largest negative theta (as percentage of the trade value, not absolute dollars). Further you go OTM, the bigger the negative theta. If the stock moves, the strangle will benefit the most. If it doesn't it will lose the most. I found that if I have enough time before expiration, deltas in the 25-30 range for both puts and calls provide a reasonable compromise. For lower priced stocks, I would prefer a ATM (At The Money) straddle (buying the same strikes). For example, strangle on a $20 stock might be very commissions consuming, plus the negative theta might be too big. Please note that when I'm talking about the theta being larger or smaller, I'm always referring to percentages, not dollar amounts. In absolute dollars, the theta is always be the largest for ATM options. However, since those options are also more expensive in dollar terms, percentage wise the theta will be the smallest. For higher priced stocks (over $100) I will usually do RIC. Since you sell a further OTM strangle against the purchased strangle, this reduces the theta of the overall position. It might be the least risky position and still benefit from IV jump like AMZN trade. I prefer to have spreads of $5 for RIC. Since I don't know what will happen with the stock I play, I prefer to have a mix of all three. In case of a big move, strangles will provide the best returns. When IV is low, RIC will provide some protection against the theta while still having nice gains from time to time. Remember: those are not homerun trades. You might have a series of breakevens or small losers, but one down day can compensate for the whole month. This is why I want to be prepared when it happens. In August I had 4 doubles in two days (but I played mostly strangles). Generally speaking, RIC is the most conservative trade due to lower negative theta (the sold strikes reduce the negative theta). But if the stock moves sharply, strangle will produce the highest gains. It also might lose the most if the stock doesn't move and IV increase is not enough to offset the theta. Let me know if you have any questions. This post has been promoted to an article13 points
-
Welcome to Steady Options! Please spend few minutes to read this post, the Frequently Asked Questions and the Useful Links. It will be time well spent. SteadyOptions is a premium options trading advisory service. We offer a combination of a high quality education and actionable trade ideas. Our forums and the trading community are the heart of the service. The focus of the service is on non-directional strategies like Long Straddles/Strangles, Calendars, Butterflies, Iron Condors etc. We always trade defined-risk strategies, never naked options. You need to create a forum account to get access to the service. We are sharing our trades with full explanation of the Greeks, the risk/reward, the best time to entry/exit, price targets etc. Full follow-up is provided, including entry, adjustments and exit. You might expect 10-15 trade ideas per month. We will usually have about 4-6 trades open, some are short term (2-6 days), some medium term (3-5 weeks). We use portfolio approach and will have trades balancing each other in terms of theta/vega/gamma. Please note that suggested portfolio size for SO trades is $10,000-$100,000. We do NOT recommend trading accounts larger than $100,000 due to potential liquidity issues. We recommend using one of our other services for larger portfolios. We will also provide options education. I encourage you to ask questions about options trading. Please note that we don't provide auto-trading. SteadyOptions is an educational resource. I want my members to be in a full control of their trading. In addition, SEC considers newsletters that engage in auto-trading to be investment advisers, and I am not licensed to be an investment adviser. So most newsletter that engage in auto-trading are breaking the law and are exposed to lawsuits like this one. You can read more details here. The SteadyOptions forum has several sub-forums (access to members only): SteadyOptions Trades - this is where the official trades are posted. Any trade posted on this forum by any of the contributors @Kim @Yowster @krisbee or @TrustyJules is considered an official trade. SteadyOptions Discussions - This is where we discuss our trades. Unofficial Trade Ideas - This is where we discuss our unofficial trade ideas. In addition, SteadyOptions members have access to all Members forums where we discuss general issues, strategies etc. You can start topics and post on each subforum except “Trades Discussions” and “SteadyOptions trades”. You can reply on “Trades Discussions” forum. Each trade has a separate topic in “Trades Discussions” and “SteadyOptions trades”. The SteadyOptions Trades forum is used for posting our trades. To get notifications about my trades, you will need to follow that forum (by clicking "Follow this forum" button). Each trade has a separate topic, with our entry price, exit price and some comments. We will start a topic for each trade in the “Trades Discussions” subforum and you will be able to post your replies. You will need to specifically follow each forum you want to get updates from. When you follow the forum, you will get an email about every new topic in that forum. If you are interested getting emails about new posts in that topic, you will need to follow that topic. We recommend to follow all forums to get notified when new trade or trade discussion is posted. You can also follow specific members to get notified every time they post. SteadyOptions model portfolio is based on 10% allocation per trade (some trades are 5% and considered half allocation). Average of 5-6 trades is open at any given time. Performance returns are based on the entire portfolio, not just what was at risk. Please note that we usually don't hold our trades through earnings, unless specifically indicated. More details: Why We Sell Our Straddles Before Earnings Why We Sell Our Calendars Before Earnings Our goal is to share our experience and to help you to become a better trader. The trading notifications are based on our real trades that we are sharing with subscribers in real time. SteadyOptions is not a recommendation letter and I am not a financial adviser. However, let me give you few general tips: We encourage you to do your own homework before following any of our trades. If you are new to options or to those strategies, start with paper trading, then start small and increase your allocation as you gain more experience and confidence. Try to understand what we are doing. Ask questions. This is why we have the forum, and we welcome questions and discussions, no matter how basic they are. Don't wait for our notification if you like the trade. Enter if you like it. Exit based on your own profit targets. Our advice to members: learn the strategies and make them your own. Do NOT blindly follow the trade notifications. You need to understand what we are doing in order to adjust your entries and exists to changing market conditions and be proactive. SteadyOptions is a trading ideas generator rather than an alert service. If you are using it as a pure alert service, you are not taking advantage of all the wealth of knowledge and learning we offer. If you expect a pure alert service where trading alerts are just delivered to you without any effort and time commitment, this service is not for you. You will be expected to invest time and effort, please do NOT sign up if you are not willing to do it. I recommend reading My Seven Stages of being an SO Member to get a better understanding of how veteran members are using the service. My commitment to you: I want to make money with you, not from you. All I ask from you is to give me a fair chance. If you decide that you like the style, give it some time to work. Don't give up after a couple of bad trades. We are here for the long run. Don't concentrate on short term performance. Concentrate on your education. Concentrate on managing risk. If you do that, the profits will come. How to make the best use of SteadyOptions For the benefit of the new members, here is how SteadyOptions works and how to make the best use of your subscription. We use a limited number of non-directional strategies, described in the following topics (access to members only): SteadyOptions strategies How we trade straddles and strangles How we trade pre-earnings calendars How we trade Iron Condors How we trade Calendar Spreads How we trade butterfly spreads Full list of "Must Read Topics" is displayed on the right side on the main forum page. Please make sure to read it. You will need a margin account to trade most of those strategies. Here is how we trade the earnings trades: Every week we post post a list of trading candidates for the next week in Earnings Trades Discussions forum. We have some general discussion about the candidates. We will post a separate topic for each candidate I think it suitable, with analysis of the suggested prices, average move, previous cycle etc. The topic will always include a link to one of the relevant strategy topics above. This allows members to do their homework and to see if they like the potential trade. If you agree with the analysis, you can go ahead and make the trade. We will try to get the trade at the best possible price. When we do, we post it under the Trades forum. You should follow this forum to get email notification about the trade. We recommend that you try to get the trade as close as possible to the alert price. We don't recommend chasing trades. We cannot tell you what is the maximum price you should pay. It is your decision. Sometimes you will be able to get the trade the next day cheaper. Sometimes you will miss the trade. We make about 10-15 trades each month in our model portfolio plus similar number of "unofficial" trades. Don't feel obligated to take all of them. After entering the trade, please set reasonable price target. We usually start with fairly aggressive target and lower it as we get closer to earnings. Please look at liquidity, especially if you trade large amount of contracts. For our earnings trades, it is very important to close them before earnings to avoid significant loss. Here is an example of a discussion topic: And a following trade notification: In addition to earnings trades, we also trade different non-directional strategies not related to earnings. There are also many unofficial trades in a dedicated Unofficial Trade Ideas forum. Those trades are not tracked but they are integral part of the service. They are usually posted by me or one of our Mentors and are based on the same strategies as official trades. They don't make it to the "official" model portfolio for various reasons, such as: model portfolio full, size of the trade too big to fit the $10k model portfolio etc. We set different profit targets and stop losses for different strategies, and we also recommend that members set their own price targets. The best way to use SteadyOptions is to learn the strategies and make them your own. If you do that, you will be able to take full advantage of our service. You will be able to make your own decisions, based on our discussions. Getting good fills is part of the learning process. Over time when members gain more experience, they learn how to get better fills. Many members started as complete novices and now they take the trades even before I do and get better results in some cases. But those things take time. I highly recommend following the discussion topics to see how other members utilize the service. I also recommend following our Mentors for valuable tips and insights (more about our Mentoring Program). If you cannot get a fill on the exact trade, there are many ways to trade the same strategy (using different strikes, different expirations etc.) If you understand how our strategies work, you will be able to do it and see what other members do. I see the community as the most valuable part of the service. New members, please spend some time getting familiar with the forum and the strategies before jumping into live trades. Why SteadyOptions is different There are many services that trade exclusively one strategy, like credit spreads. While they might make decent returns 9-10 months per year, 1-3 bad months when the markets make sharp moves can wipe out months of returns. At SteadyOptions, we offer a complete portfolio approach. We use a diversified approach by trading a mix of non-directional market neutral strategies and balancing the portfolio Greeks. In order to hedge our theta positive gamma negative trades (like Condors and Calendars), we will always have gamma positive trades like straddles or strangles. We will discuss the following key elements for our earnings trades: Which strategy is appropriate for the specific stock. When is the best time to enter. What is the optimal entry price. Backtesting of previous cycles. What is the appropriate adjustment. What is the profit target. How Theta, Vega and Gamma impact those trades. Please make sure to read Frequently Asked Questions for more details. Finally, a quote of one of our members: I see SO as an educational course with live trades examples and the ability to discuss them with a like minded community. I don't expect or frankly care to perform as well or the same as the official returns, for the most part I don't even enter official trades unless it fits with my own strategy. Or the sectors/symbols that I like investing in and a myriad of other factors. So far, I learned a great deal directly and indirectly from SO and see a good ROI from both trades and knowledge accumulation. The truth is that about 90% of options traders will either breakeven or lose money. The same applies to any competitive sport or business, 90% will give up and stop playing, 9% will be considered average or good players and the top 1% the pro athletes will thrive. The copy and paste approach doesn't work for options... there are no shortcuts. Don't expect to look or learn how a marathon runner is running and expect to be able to run the marathon faster or even at the same pace. A person search for a one solution fix all or the "holy grail" is futile, there is no such a thing. The only thing that works is hard work, dedication and continuous learning. Every athlete will tell you the same.


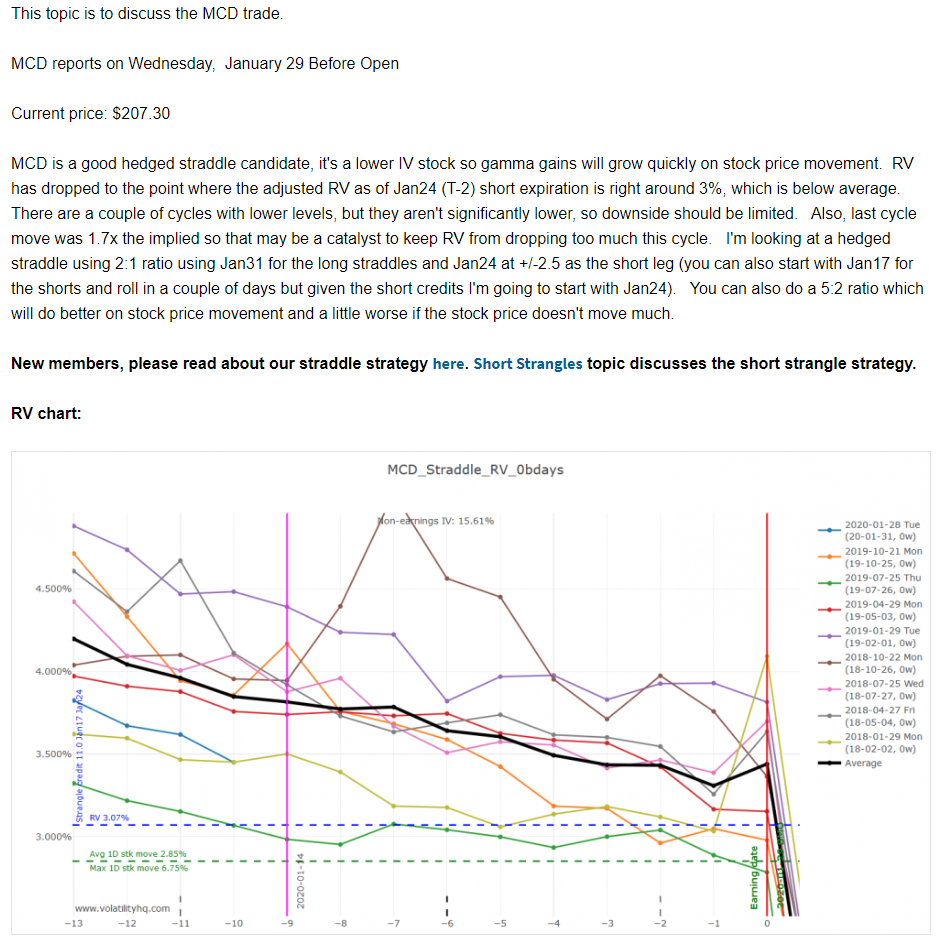
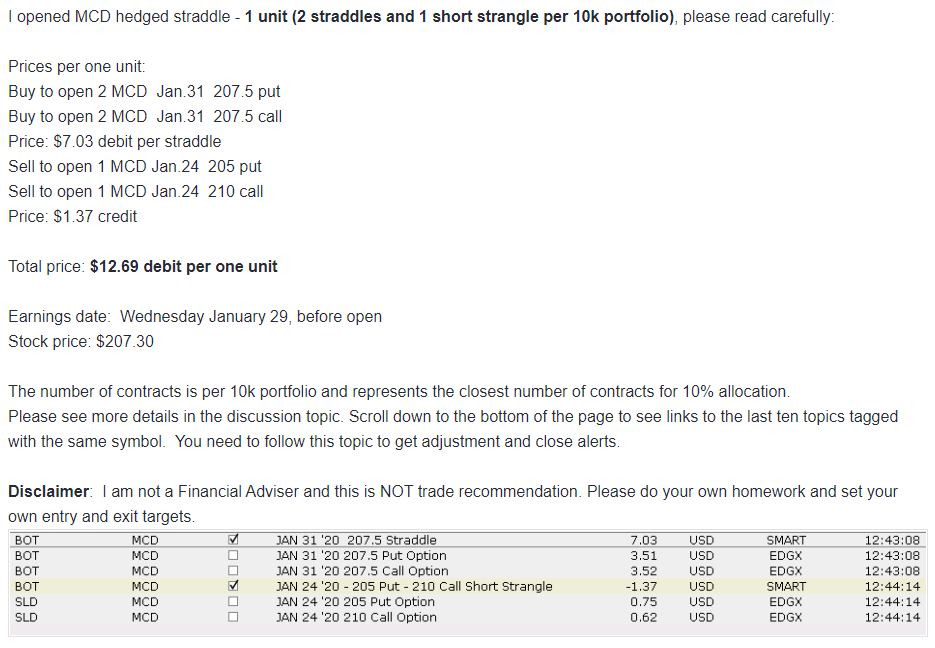 12 points
 -
Thank you Kim. I had an Oscar-award-acceptance type speech written for this moment, but it got eaten by the cat (the one I no longer shout at). It has been a great honour to be part of the SO community, and being a mentor is a real privilege. I have truly gained so much by being a member and it's time for me to give something back. And a big "thank you" to the wonderful members and mentors here. I will assist and guide others in the same way that they have me. I remember the days when I was a wet-behind-the-ears newbie. I had been trading options for over a decade but realised very quickly how little I knew when I read this forum. I would often ask dumb questions, but was given the freedom and space to do so, as the folk were helpful and supportive. My learning and growth accelerated. I stumbled and staggered my way through trades before learning to walk and then to hobble and now perhaps even run at times. I look forward to my new role with enthusiasm and a big smile on my face. ( @TrustyJules, sadly I AM old enough to remember the Sinclair ZX computer - I REALLY wanted it as a child, but no money meant we could not afford the £79. For a year, I cried myself to sleep. This....and the un-fulfilled crush on a cute little girl in my class - were the two most painful memories of my childhood. Ah.....good times.....) Anyway, back to trading....12 points
-
The award for January 2021 goes to our long time mentor @rasar @rasar is with us for over 3 years and his contributions are highly appreciated by members! Thank you!
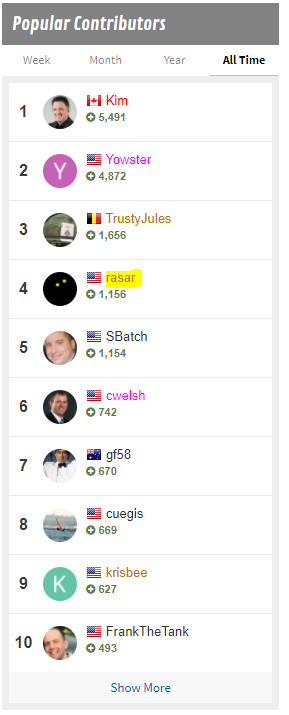 12 points
 -
Most members will know www.art-of.trading, an open website I run with the purpose of easy plotting RV charts. Now I have some bad news to convey. But there is some good news also. First the bad news: I will discontinue www.art-of.trading. After running it and offering its content for free for more than a year now I will not maintain the webservice longer in its current form. Daily updates will continue for now but the site will not be accessible anymore within some short period of time. Now here is the good news: There will be a replacement - a good one. Taking the essence of numerous discussions here on Steady Options and my personal take-aways and learnings from running art-of.trading I am up to offer an entirely new service for providing tools for trading the Steady Options way (in the same breath I should add a big thank you for all remarks and positive feedback I have gotten over the entire period. That is what made me take that route. On top I see that Steady Options continues to be a unique community on the web for trading options, with very good people and quality content - reason enough to stick around). I invite you to take a look at https://www.chartaffair.com Currently the site is working but open only to beta testers and not 'officially' released yet. Am still looking for some more beta testers. If you want to have early access I invite you to PM me for a free invitation code. Beta testers will get free access for some time once the site launches officially. Technically chartaffair.com is a more professional approach to running a webservice. And I have completely redesigned its code base. It uses a new data architecture, specifically targeted at handling and serving from large amounts of data. This together with fast hosting hardware and the use of new web technologies allows for two things: 1) Greatly increase available information You will find much more tables and graphs for each symbol with all information needed for trading the SO way: Historical implied move vs. actual move (as graphs and tables), credit needed for hedging straddle decay, actual performance of straddles around earnings. But also basic stuff like the next dividend ex-date or how long before the actual earnings announcement the announcement date gets confirmed (more details on specific features in later posts). Also, you will find practically any symbol now which comes at least with some traded options volume. 2) All information for a symbol aggregated on one single page Having all information in one place elminates the need to jump back and forth between different pages and websites, having to reenter the same symbol again and again (which I understood is an issue). A side bar allows for easy and fast navigation up and down on the page. All features came out of discussions and from my own experiences while trading. I believe they will be helpful. I will introduce some in greater detail in a couple of follow-up posts in this thread. On top of that there are a couple more pages to be added to this site. They are in planning and partly already in implementation. They will be added in the course of the next weeks/months. Chartaffair will be a paid service after the beta phase (it is not possible elsewise. But it will be worth it.) Now, if you found art-of.trading helpful over the course of last year, I invite you to sign up to chartaffair.com when the beta phase is completed. You will find it even more helpful. 2026 UPDATE: This tool has been discontinued.11 points
-
Member of the month award for May goes to @Bullfighter for his continuous contribution to SY forums.11 points
-
Over the years, I've made many mistakes when trading calendars - some really silly and basic ones, some I'm proud of, but most I'm ashamed to admit. Basically, I screwed-up often and consistently. So, one of the things I started to do to reduce this, was to actually keep a track of my mistakes. Emotionally, it was very easy to just "overlook" the mistakes I made and move onto the next trade. I think this is called Avoidance or Denial. I did both. And I did them very well. But writing down my cock-ups was tough, because I was looking in the mirror and having to answer to myself. Not an easy task, as the ego would get in the way, but it was a task which I found immensely useful. Sometimes, in trading, as in many other things, simple and basic tweaks can have a significant impact on results. So, I created a simple page in my Excel journal, just for my errors. I display below the entry from Feb '21. It's nothing ground-breaking; it's simply a list of the types of mistakes I made, how often I made them and what stocks were involved. (This is just for Calendar trades.) Just for clarity, the descriptions are as follows : 1. Not reading the Notes/Journal before trading. I keep a journal not just for the trades I take, but I include a section where I describe what my experience was with that stock for that cycle. A summary, if you like. And the aim is to read the journal summary before I open a new trade the next cycle. 2. Buying too far from ATM Self-explanatory. 3. Looking over the cliff. If I have a cal at say the 250 strike and the stock moves up to 260, then I'm still OK. The stock moves up to 265 a day later and I'm still kinda okay-ish. But I'm now getting close to the "tipping point" - any further rise in the stock price now will accelerate the loss in my cals, asymmetrically. By not taking action when the stock is at 265, I'm "looking over the cliff". Looking at large impending losses if the stock continues its upward trend and if I take no action (eg closing for B/E or small loss; opening a new leg at the higher stock price etc). 4. Under/Over-allocating. Self-explanatory. One of the best practices in trading (I found) was proper position sizing. 5. Mon/Tue - not closing soon after market open. This is a personal observation - if the T-0 was Mon or Tue, I found that my cals often fell in value as a day progressed. So, I felt it important for those situations to close early in the day. 6. Holding low-volume stocks till T-0 As mentioned in other posts, it's possible to get "stuck" with cals on T-0 where there is very little volume/OI. So, the aim for me, is to try and close them by T-1. 7. Not closing half at 30%. Oh yes, good old fashioned Greed. A classic case in Feb '21 was AMZN - my cals were 30%+, but I held on - the next two days, the market shot up, AMZN moved a lot, IV fell sharply, and my cals were now showing a -5% loss. Nice. I had grabbed defeat from the jaws of victory. 8. Holding through earnings. This is a cardinal sin which I committed many times by forgetting to close the trade on T-0. To get around this, nowadays, every time I enter a trade, I immediately put a 'Close' alert in my MS Office Calendar. As you can see, I made a total of 13 mistakes on my calendar trades in that month - that's waaaaay too large a number, and this resulted in me making a loss of the whole month - my first loss after 14 consecutive profitable months. Even just doing the basics right - eg. allocation - would have eliminated 3 mistakes. And closing the AMZN calendar for 30% profit, instead of -5% loss would have made a $$$ difference to my final returns. This list is not definitive by any means - it's just my own personal list. Every trader will have their own one. And that list will be different for different types of trades (eg. straddles will have their own peculiarities). I thought I would share the importance of keeping some sort of written records of the lessons learnt - it's not a sexy part of trading, and it's never easy admitting our mistakes (even to ourselves), but the more we can make trading mechanical, logical, mathematical and the less we make it emotional, egoistical and impulsive, the more chance we have of being profitable. Happy trading!
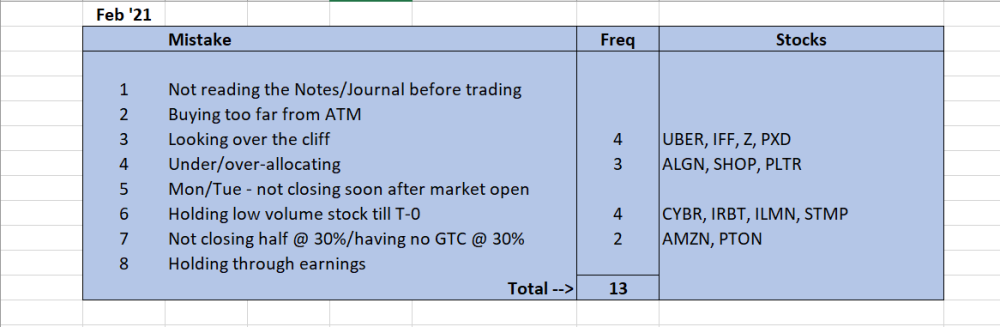 11 points
 -
Member of the month award for September goes to @TrustyJules Probably doesn't surprise anyone, but I thought we should give another recognition to Julius' amazing contributions. This community wouldn't be the same without him.11 points
-
Please welcome our new mentor @zxcv64 I'm sure most members already know this long time member and can appreciate his experience and wisdom. Now we just make it official.11 points
-
Member of the month award for February goes to @Ringandpinion I cannot believe that @Ringandpinionhas been SO member for less than a year. In this short time he became one of the key members of our community. His contributions and his sense of humor are always welcomed and well received by our members. Thank you @Ringandpinion!!11 points
-
Hi guys, This is the address to a website I just finished (well, let's say it is in beta): www.art-of.trading It is helpful for those in search of an additional source of RV charts (and thank you for all encouragements I got). What's this? You can use it to simply and quite quickly depict the 'usual' RV graphs on straddles and calendars, as well as the underlying’s relative movement and IV. Most parts of the website were plugged together by me (you will notice in the grainy front picture). It also has a page with a large table on upcoming earnings, the firm’s actual and historical IV and traded options volume in weeklies and monthlies. The goal was to plug all this information together in a more ‘trader-friendly’ way, better than on other known free website (the basic idea is to provide an answer to Kim's weekly Sunday mail about upcoming earnings trading candidates and the famous 'make sure they are liquid enough' sentence). Do we really need another website with RV charts? Well, honestly, I do not know. You will have to judge for yourself. I can only say that this is a fun project for me personally and I just could not help tackling this. Having spent some years in quant finance/institutional asset management and having fun doing quant stuff and building webpages I could not keep my fingers still and had come up with that website - despite what else might be there (and not even thinking in a particularly competitive way about it). It is very helpful for what we are doing. Technically not rocket science, although some parts still turned out taking more time than expected (I am still completely amazed, for example, about being taught all the legal implications of throwing a few figures on a website). What’s your incentive in this? Will you keep this free? What I like about this forum is that there are quite a few people who are really good - and who do not mind sharing their knowledge and their experience. I like this spirit and I want to support it. Now, having said that, here is the money side: be clear that you need to spend some good amounts on data, hosting and development (the ones I would just be too slow to all do myself). Properly licensing your data, for example, is unfortunately much more expensive for a thing like this than for private research purposes (and of course more expensive than if you would simply scrape your data, but experience shows you want to stay clean on that one). Proper data has the nice side effect that you always have good and consistent data and finally that there is someone you can call if something goes wrong (f.e. Zacks I use is known as a good provider of earnings data). So again, having said that, the answer is no, I will not be able to keep this for free. Costs and time should be covered. Be realistic, you will agree that anything else is simply not sustainable. Furthermore, being able to access up-to-date data on any company at any time has value. So you plugged this site together, and what now?? While many people say a quant background can actually be a disadvantage in trading, I will still love to do more interesting data driven stuff, possibly in collaboration and discussion. And the useful stuff will of course go on the website. So, I am open and thankful for suggestions and discussions. But I also want to add a cautioning word that in my experience it is often the very simple stuff which helps most. There can be an inherent danger to lose purpose when getting too carried away by shiny advanced methodologies and too much use of differential equation models. There is, however, a lot of basic stuff with seemingly little coverage here in the forum which could well value a look. For example, taking some simple company fundamentals like earnings growth, earnings volatility, even debt-to-equity, industry code, past surprises and plugging them into a simple regression to come up with a model to predict iv runup before earnings announcements. There is a good chance that this will lead to improvements with reasonable time spent on them. The coming weeks will be a test run, the site will be freely accessible (in fact there is nothing in place on the page which would allow to charge anything right now). I would love to get some feedback and of course bug reports if you find funny data or anything not working as expected. So that is it, enjoy.11 points
-
Please welcome our new mentor @TrustyJules He has been with us for less than a year, but I think many of us learned to appreciate his experience and his contribution to the forum discussion. His posts are always very helpful and to the point. @TrustyJuleswill be responsible mostly for Creating Alpha forum, but of course will continue contributing to SO forum as well.11 points
-
Thanks. I'll come back from this. Just a set back and good lesson. Almost all traders have blown up a least one account. Here are some key points from my debacle: 1. Always research a new trade and review the old trades periodic. 2. Always have a well thought out thesis. 3. Understand what are the risks - There's always fricken risk to every trade - I had over 10 million dollars worth of theoretical risk that I didn't know about in my TLRY trade mainly in the short calls. 5. Ask your broker if this is a good trade - my broker explained that TLRY spreads where trading more than the width because of the carry cost of the short calls. I would have not entered the trade had I known this and save myself from a six figure loss. However, I probably would have lost this some other way. 6. Paper trade it first 7. Trade small 8. Trade small 9. See #7 and 811 points
-
As I’ve done the past few years, I’ve broken down the Steady Options 2015 trade performance by trade type (there are a few open trades but these may not be closed until January). Here’s are this year’s stats along with some comments from my perspective... Pre-Earnings Calendars 51 Trades – 41 win, 10 loss (80% win) Average gain 12.67% Comments: Again one of our best performing trade types. Basically the same number of trades as last year (51 vs 48). We were probably on pace to have significantly more of these trades than last year, but large volatility jump in the Fall made entry prices not good from a historical perspective and therefore not many of these trades were placed during that timeframe. Win rate up from last year (80% vs 71%) Average gain down slightly from last year (12.67% vs 13.80%) Note that there are a few non-earnings calendars in here (like GOOG), but I included all company calendar trades in this section. Pre-Earnings Straddles/Strangles 34 Trades - 23 win, 11 loss (68% win) Average gain 2.61% (3.88% if you exclude the large QIHU loss) Comments: Count of these trades way down from last year (74 down to 34). Avoided trades on low IV stocks that were the poorest straddle/strangle performers in past years. Win percentage and average gain both up from last year’s percentages of 62% and 2.54%. Despite modest gains on straddles/strangles compared to some of the other trade types, these trades receive a lot of discussion in the forums. Rolling strikes as the stock price moves around is a big topic – note to some of the newer members, rolling does not lock in profits! (it may do so on one leg of the trade but the overall trade may still be down). There is no right answer to the rolling vs not rolling question as sometimes each will perform better. Index trades (RUT, SPY, SPX, TLT) 31 Trades - 21 win, 10 loss (68% win) SPY/TLT Combo: 6 win, 4 loss, avg loss -0.32% SPX and RUT Iron Condors: 3 win, 1 loss, avg gain +4.95% SPX and RUT Calendars: 5 win, 1 loss, avg gain +4.73% SPX Butterfly: 7 win, 4 loss, avg gain +3.49% Average gain 2.69% Comments: Large market moves this Fall were not good for these trades. When the market was relatively calm these trades performed well, when the market was volatile they performed poorly. VIX trades 11 trades - 10 win, 1 loss (91% win) Average gain 28.15% Comments: Overtook pre-earnings calendars as our best performing trade type this year. 8 of the 11 trades were VIX calendars and the ability to place these trades is very broker-specific. If you are not using IB ($150 margin per calendar) other brokers margin requirements are much higher and some will not even allow you to open the trade. I fear that many SO member missed many of these trades because they use brokers other than IB, which is a real shame as the stats clearly show that these trades were the best performers.11 points
-
MANAGED ACCOUNTS Steady Options frequently receives questions from our members for assistance trading the strategies offered and discussed on the forums. The reasons a member might want such assistance can be many – from simply not having the time to fully trade the strategy to simply wanting to watch actual trades occur in real time for a while. Other people simply struggle to obtain the same fills that are listed on the site. One of the more under-utilized options available to Steady Options’ members is access to managed accounts, which provide this exact service. We have learned that many members do not fully understand what a managed account is, how it works, how one is opened, the fees involved, and generally how they operate. Hopefully, the following FAQ answers these questions. 1. What is a managed account? / How do managed accounts work? A managed account is a specialized investment advisory account that uses one particular strategy. It is an account you own, maintained through a custodian (such as TD Ameritrade Institutional or Interactive Brokers), that is managed by an investment advisor. A typical Lorintine Capital client who utilizes a managed account typically has the following: (i) a retirement account, (ii) a traditional investment account, and (iii) a managed account (that trades the Anchor Strategy or Steady PutWrite or ETF BuyWrite). The account belongs to the client (unlike with a hedge fund, which owns the account) and the client gets a monthly or quarterly statement from both the broker and Lorintine Capital. Managed accounts utilize “block trading,” which ensures all clients are equally treated. Let’s say there are 10 clients, each needs one contract on a trade. Instead of entering 10 different trades, one in each client account, only one trade is entered for all 10 contracts. The resulting sales price and commissions are then equally divided among all clients. That way all clients using a managed account get the same fill prices – which may not occur on 10 separate orders. 2. Why would I use a managed account? The simplest answer is ease. Lorintine Capital is a licensed investment advisory firm. Lorintine runs some of the strategies discussed in these forums in managed accounts. It takes the burden of trading off of you by having the Firm make the trades and removes some of the potential margin of error. If you’re a “DIY” individual, who wants to have complete control over your account, you may still prefer to maintain your subscription and trade yourself. 3. Who owns the managed account? / Do I have access to the managed account? One of the most important parts of a managed account is that you own it. This means you can log into the broker (e.g. TD Ameritrade Institutional or Interactive Brokers) and view your account at any time. You also have the ability to remove Lorintine Capital as the advisor on the account at your sole discretion at any time. While we don’t recommend this, as you may have open positions that need to be managed, it is your account, and you maintain control of the account. The account will be in your name with statements sent to your address. 4. Who trades the managed accounts? The account is traded by Lorintine Capital, a registered investment advisory firm. The strategies traded are traded by the same individuals that run the coordinating forums: Anchor and Leveraged Anchor – Christopher Welsh SteadyOptions strategy is not offered as part of managed accounts due to potential liquidity issues. 5. Do I receive statements on the managed account? Yes, you will receive a monthly statement from TD Ameritrade Institutional or a quarterly statement from Interactive Brokers. You'll also have online account access to view the details about your account at anytime. 6. How can I close the managed account? Your managed account can be closed at any time for any reason. We recommend that you close the account after discussing the matter with us, so we can ensure appropriate liquidation strategies minimize potential transaction costs. However, you can always close the account by directly contacting the broker. 7. How much do managed accounts cost? Managed account fees vary by the strategy. Anchor, Leveraged Anchor – 1.75% of total assets under management, taken monthly (1/12th of 1.75% each month). Fee discounts may be negotiated on an individual basis for larger accounts or those that open other advisory accounts with Lorintine Capital. There are other fees that will be incurred on the account that go to the broker. Such fees including trading costs and commissions. Neither Lorintine Capital nor Steady Options receive any of such fees, soft dollars, or other “kickbacks” on the fees charged by the broker. 8. Do I get a discount at Steady Options if I have a managed account? / Do I have to maintain a subscription to Steady Options if I have a managed account? In order to have a managed account, you must also maintain an account/membership with Steady Options. While Steady Options has a working relationship with Lorintine Capital, they are two separate businesses. Steady Options is not a registered investment advisor. However, depending on your account size, discounts may be available. If you place $100,000 or more into a managed account, you will be entitled to a 50% discount on Anchor Trades, monthly subscription fees. If you place $200,000 or more into a managed account, you will be entitled to complimentary access to Anchor Trades. 9. How do I open a managed account? / What paper-work do I have to fill out? Opening an account is simple. Contact Lorintine Capital at info@lorintinecapital.com or contact Christopher Welsh @cwelsh The paper work comes in two forms: A. An investment advisory agreement with Lorintine Capital. This is a contract between you and the Registered Investment Advisor. It gives Lorintine Capital permission to trade your account in the designated strategy, charge and collect fees, and provides the legal terms of the relationship; and B. Accounting opening documents with the broker (TD Ameritrade Institutional or Interactive Brokers for Lorintine Capital managed accounts). They typically consist of a disclosure statement, account application, options and margin forms, and banking information. 10. What is the minimum size for a managed account? Anchor Trades/Leveraged Anchor $50,000 11. I am not an accredited investor or qualified client, can I still use a managed account? Yes. 12. I am not located in the United States, can I still use a managed account? Possibly. If you are located in any European Union country, rules and regulations that went into effect at the beginning of 2019 essentially prohibit you from opening an investment advisory account individually in the United States. If you are in Canada, regulatory rules prohibit such investment. Other countries vary depending on their location. However, this does not mean such investment is impossible. Rather you must: A. Open a US based entity, typically a C-Corp; B. Obtain a US tax identification number, called an EIN; C. Maintain a registered agent in the United States; and D. Have the company file an annual tax return with the IRS. You may not have to file an individual tax return but discuss this with your tax professional. We realize most investors will not want to go through these hurdles. Also, it may not be financially prudent unless you have a larger account or have other accounts managed by Lorintine Capital, due to the expense of opening the entity and paying a US accountant to file your corporate taxes. 13. If I have questions about my managed account or opening one, who do I contact? If you have any other questions regarding a managed account, please email Lorintine Capital at info@lorintinecapital.com.11 points
-
As all our American friends are recovering from their dinners and drinks, a bit of light humour on this Monday. A friend of mine knew I was an active trader and asked whether I could share my portfolio with him and we could then discuss it. To be fair to him, he was a complete newbie and I restricted myself to sharing my shares portfolio explaining that the options bit is perhaps a bit complicated. The idea was that we would talk about it and how to build a balanced portfolio, again credit to him he took it seriously and researched the companies in my portfolio perhaps further than even I had. He therefore came prepared with his homework for our discussion this weekend and proudly laid out what he found, prefacing it with: "I researched all the companies in your portfolio, there is just one I had an issue with: ALPHABET, I googled it but can't find out which company it is."10 points
-
Member of the month award for August goes to @Chuck451 and @TraderSL for their continuous contribution of trading ideas and analysis.10 points
-
For anyone interested here is a lightweight tool for plotting real-time and historical intraday RV values. Download: bit.ly/rt-rv Short video on major features: bit.ly/rt-rv-v This tool is provided for free for your convenience. It is excel based and uses Interactive Brokers API for real-time data (follow instructions on download page). Feel free to download and use it. It works completely independent of any chartaffair subscription. However, if you happen to have a valid chartaffair premium subscription it will additionally produce up-to-date earnings data through the chartaffair API. The test key included will work for a few days from now. The VBA code inside is 100% open and accessible and anyone wanting to is invited to modify and repost it (f.e. to add more brokers).
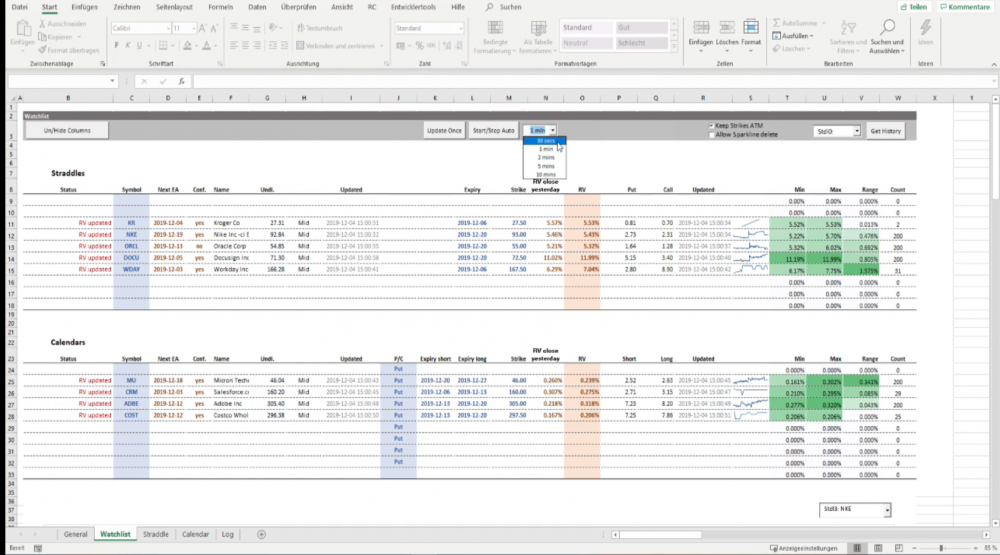
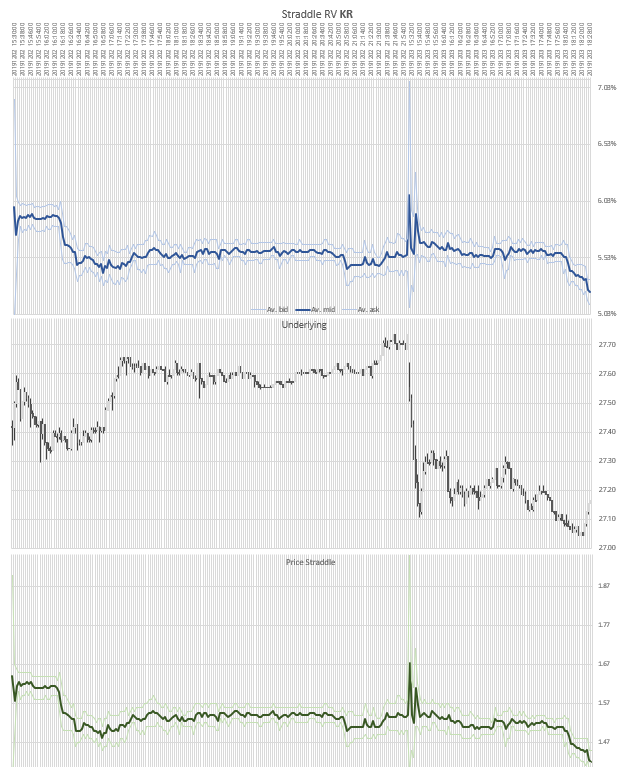
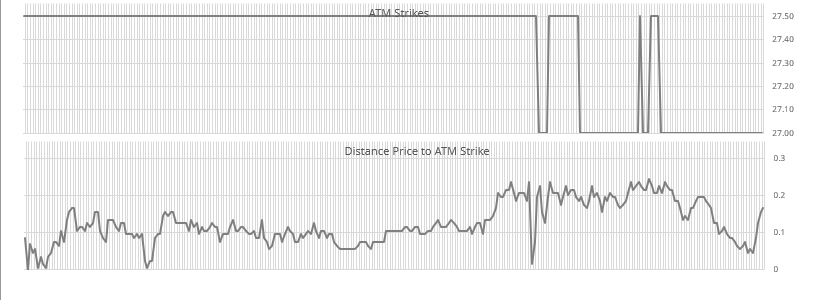 10 points
 -
Member of the month award for April goes to @ParadigmAU for his continuous contribution of trading ideas.10 points
-
Member of the month award for March goes to @deepvalue4ever for his continuous contribution of trading ideas.10 points
-
Member of the month award for July goes to @White_Oak This member is another example of a member who is taking very seriously our suggestion "learn the strategies and make them your own". His MRNA trade alone (along with other trade suggestions) makes him eligible to this award.10 points
-
Wow, I didn't even know this was a thing. Thanks for making my day! As if this UNG trade wasn't enough to be smiling about. I'm honored, especially with so many amazing folks from whom I've learned a tremendous amount from -- shoutout to @TrustyJules for a few epic contributions this past month and for giving me a sobering expectation on a few of my own trades. Your BIIB trade was epic, and while I didn't get in on the trade regrettably, I did a nice followup with a calendar the day of the announcement. @Yowster for giving me greater confidence on my butterfly trades, and a more recent honorable mention to @Ringandpinion with whom I hope to collaborate on some future negative delta trades to help offset longs. I've got some things I've been working on with TOS API to aid in realtime Calendar and Butterfly spread analysis hope to share with community soon. As a veteran software engineer I could be doing a lot more to help this awesome community!10 points
-
SteadyOptions FAQs What is SteadyOptions? SteadyOptions is a Premium Options Education service. We offer a combination of a high quality education and actionable trade ideas. My goal is to share my experience and to help you to become a better trader. The trading notifications are based on my real trades that I'm sharing with subscribers in real time. SteadyOptions is not a trade recommendation service and I am not a financial adviser. I see my first mission to educate you about options. Ask questions. Concentrate on your education, not on a short term performance. Please read Welcome to SteadyOptions post for more details. How do you recommend to start using the SteadyOptions? If you are new to options or to those strategies, my first recommendation would be: start with paper trading. Then start with small positions and increase the allocation gradually as you gain more confidence. How much can I expect to make with your service? It is important to set realistic expectations, but it's ultimately up to you. I never make any promises or guarantees. You can visit the Performance page to get an idea about our results. What is your trading style? We trade a variety of non-directional defined-risk strategies. I'm a big fan of the "slow and steady" approach. We aim for many singles instead of few homeruns. Our first goal is capital preservation instead of doubling your account. Think about the risk first. If you take care of the risk, the profits will come. How do I get the trade notifications ? We will post a topic in the SteadyOptions Trades forum (members only) when I enter, adjust or exit a trade. If you want to get notifications about the trades, you should follow this forum (by clicking "Follow this forum" button on the right upper corner of the forum page). If you follow this forum, you will receive an email when a new topic (trade) is posted. If you want to follow that trade, you will have to follow that specific topic in order to get notifications about the new posts in that topic. To get notifications from any forum, you need to follow that forum and then each topic individually. Read more in here. All open trades are listed under SO Open Trades. I also send the notifications on Twitter, at protected account SteadyOptions. In addition, there is also an option to "follow" a member to get his content, so you can follow all contributors who post trades. When the trade notifications are sent? All trade notifications are sent during market hours. You don't need to be glued to the computer all day, but you should be able to place trades during the market hours. We provide a full follow up on all trades (open, adjust and close). Do I have to wait for your trade alert? No. In the Earnings Trades Discussions forum (members only), I will start a topic to discuss every trade. I provide my entry and exit guidelines and profit targets. I strongly recommend that you follow that forum to see the rationale behind the trades and also to get some heads up before I actually make the trade. I encourage members to set their own profit targets and follow them. Which strategies do you use? We use a mix of non-directional strategies (members only topic): earnings plays, straddles/strangles, Calendar spreads etc. We always trade defined-risk strategies, never naked options. The focus will be on pre-earnings plays. The strategy is based on my Seeking Alpha articles Exploiting Earnings Associated Rising Volatility and How To Rent Your Options For Free. I encourage you to read those articles before trading any earnings related trades. This strategy is based on aiming for consistent and steady gains with holding period of 2-5 days. We will always close those trades before the earnings announcement to avoid the IV collapse. Please note that you will need a margin account to trade most of those strategies. Can those strategies be implemented in IRA accounts? It depends on a broker you are using. Most brokers will allow trading risk defined spreads in IRA accounts, but it's better to ask the broker. Please read more details here. How many trades do you typically have and how long do you hold them? We usually have 2-4 earnings plays with holding period of 2-7 days. In addition, we might have 2-3 theta positive trades like Iron Condor, butterfly and/or calendar spread, with holding period of 3-4 weeks. From time to time, we also trade other instruments, like GLD, VIX, VXX, SPY, TLT, UNG etc. to take advantage of special situations. How do you calculate your performance? We use a model portfolio of $10,000 and allocate $1,000 (10%) per trade (some trades have half allocation or 5%). Since we usually have around 6-8 trades at any given time, this method reflects the growth of the entire account even though we don't have more than 60-80% of the account on risk most of the time. Please remember that posted returns exclude commissions. Please read How We Calculate Returns? for more details. What is the minimum account size to trade those strategies? I recommend at least $5,000 account to start with, $10,000 is better. I do NOT recommend trading accounts larger than $100,000 due to potential liquidity issues. Are commissions important? Commissions are important for any strategy, and they are especially critical when trading multi-leg options strategies. If you are paying more than 1.0-1.5% commissions (as percentage of the trade value), it is time to change broker. See more details here. I missed the trade notification and the price is now higher - should I pay it or wait? I recommend to be patient and let the price "come to you". Most of the time, you should be able to get a similar fill as I do. In fact, in many cases, by being patient members could achieve better fills. As a general guideline, if the stock is still near the price where I entered and the trade price runs and then comes back, I still consider it a valid trade. How much should I allocate to any given trade? It is up to you and based on your risk tolerance. I discussed the importance of position sizing here (members only topic). Since most of the trades have a low risk (typical loss is in the 10-15% range), it is possible to allocate 10% per trade and still risk only small percentage of the account. Why you don't offer auto-trading for SteadyOptions service? SteadyOptions is an educational resource. I want my members to be in full control of their trading. In addition, SEC considers newsletters that engage in auto-trading to be investment advisers, and I am not licensed to be an investment adviser. So most newsletters that engage in auto-trading are breaking the law and are exposed to lawsuits like this one. You can read more details here. When you issue a trade notification, wouldn't all our orders affect the prices? It is important to use limit orders and not to chase. However, since spreads are already hedged or partially hedged, they are always easier for the market makers to handle, and they prefer those trades to single orders - there is less urgency for them to 'get flat'. The market makers must trade to make money, and no reasonable order should be difficult to fill. However, I also limit the membership to ensure the best fills for our members. I work full time, will I be able to benefit from the service? We have a lot of members who work full time. You don't need to be glued to the computer all day long, but you do need to have access to the trading platform during market hours. Usually it is okay to place the trade within few hours after the trade alert. Please refer to General FAQs for questions relevant to all services. If you have any questions related to services, subscriptions etc. please PM me or use the Contact Us form. For any trade related questions, please post on the relevant forum. Click here to subscribe10 points
-
A key part was the option leverage - it allowed the small guy to force purchases in Gamestop by the market makers and they ran out of shares to borrow. Gamestop had a rather small market cap and the short percentage was very high - the funds that piled into it took a risk by shorting so much and they got burned. All the affected stocks were relatively small ones in terms of free float and in those cases a short squeeze can be a lethal danger. The funds just got greedy and were caught at their own game, I posted before about Porsche outwitting the short funds a while back - the Gamestop case is extraordinary but in the end its just the market correcting itself. Hedgefunds shorting stocks had it too easy, they would almost at random pick a smaller stock and crush it exiting quickly with a buck fleeced from retail investors - the Gamestop story was very far from any in depth analysis that justified a short on fundamental grounds. It was a play on a market sentiment that bricks & mortar will fall to the internet and corona. It didnt consider the stock wasnt liquid enough for the size of the short position : GME shares outstanding ~70M - valued before all this stuff happened at 5$ or 350M 27% were institutionally held so not tradeable. Left value of ca. 245M 113% of the stock was shorted (and I dont think this was even the highest level) It doesnt take a genius to figure out that this setup is vulnerable to a squeeze. So how do we go about that? Well its rather easy - Gill actually encouraged buying far OTM LT options for nickels and dimes. This forced moderate (delta related) purchases by the MM but in the overtensioned short market it became a problem - where were these shares supposed to come from? So lets see how that works, lets presume they piled into 10 delta calls which cost a dime each. To affect say 1% of the free float which at best was 50M shares (in reality it was likely much smaller) - you need to get 500,000 shares purchased. So if you manage to get 50,000 contracts opened you are good (remember option leverage is 1 contract for 100 shares but 10 delta means only 10% are bought). That is in fact only 500,000$ if they trade for a dime - there is a flywheel effect on this as the squeeze starts to bite the price accelerates and delta hedging will increase the amount of shares the MM need to cover positions. So 100 retail investors putting up 5K each could do the trick - hedgefunds operate in much the same way in wolfpacks - what played an additional role is that GME had been flat for so long the original option prices were completely deflated even for longer term calls. With 113% short of total float what could a 1% purchase do? Your guess is as good as mine but we saw the results - what made matters worse is that #MeToo funds with even less sense than Melvin started to short the stock thinking they saw an easy gain. These were not the most reliable of shorting parties and when they started to bleed they ran away real fast thereby giving the old flywheel yet another spin. Thats why on a position where you would think the risk would be what? 20-30% of your short position? The funds managed to lose 5B$ and even then they were lucky, the VW Porsche case showed that in a short squeeze prices tend to infinity - Melvin & Co literally could have lost an infinite amount of $$$. Whether a stock is valued correctly or under/overvalued depends as much on fundamentals as on offer/demand. There are plenty of quite good stocks trading at low prices due to being unpopular similarly your favorite TSLA is trading at some absurd levels.10 points
-
I don't mean to sound indifferent as I remember feeling like this too. I remember getting so excited about the official SO performance and I was day dreaming about all that money I was going to make. Each time I saw Yowster and other make profits when I was losing money felt like a knife being jammed into my heart. It sucked. I get it. Based on my own journey - the sooner you stop trying to duplicate the official trades and admit to yourself that you cannot duplicate them the better. Unsubscribe from the SO alerts and just follow the unofficial trades and the trade discussion group to see what people are looking at (many times you find these trades before the official ones giving you a chance to get in early). Are Kim and Yowster trying to pull a fast one on us? No - but you also cannot replicate their trades exactly because some of these trades have low liquidity. As soon as any market maker sees 100s of orders coming in at the same strike they are going to raise the price of the options. This means you will always get filled on the losing trades and maybe get filled on some % of the winning trades. This can easily flip a strategy that makes 50% a year to one that makes 0% per year. So - once you admit that to yourself you have two options: 1) Give up. Move onto the next guru who claims they can make you a millionaire. 2) Figure out how you can make this strategy work. Whenever you miss a trade you can complain which won't change anything or instead ask Yowster what exactly he was looking for when he entered. Learn from him so you can spot your own trades and maybe get in before everyone else. I went from complaining about SO and quitting here to just closing out several calendar trades for 30% each. None of them were official trades or even mentioned on the board here. Just used the information Yowster teaches us and VOLHQ to find my own setups.10 points
-
Please welcome two new mentors @Djtux and @Christof+ I'm sure most our members know those two members very well. They helped hundreds of members, are well respected in our community - we just making their status "official". They have developed two excellent tools that are widely used by our community members: volatilityhq.com and Chartaffair.com - both tools have RV Charts & Backtesting for Steady Options.10 points
-
I would have lost over half a million had not gotten out Monday. I believe the grace of God helped me liquidate near 1000 flys on Monday one day before the break out. Sorry to everyone for the worst trade in history. On the bright side, I believe this loss made me a better person. It nearly took everything away from me and taught me not to take anything in life for granted because it all can be gone with one press of a button (in my case, many presses). It's only money. My biggest fear was this trade was going to take away my health, friends and family. A loss that would have ended everything. I know we traders want to make money trading, but I think if we focus too much on money, the more we tend lose it. Good trading is all about the process and not the money.10 points
-
I just wanted to post a thank you to all the SO members for their kind words posted in this thread and in other messages that came to me. I'd also like to thank @Kim for approaching me with this opportunity - and having the trust & confidence in me to do so. I was overwhelmed by the number of my new followers after this announcement, which reminded me of the size of the SO membership outside of those that are regular forum posters. I'll echo what Kim has always said - to get the most out of SO, don't just follow the trade postings, learn the strategies so you get to the point where you are able to analyze your own trade candidates and open your own trades. Its ok if you don't post comments/questions in the forums but try to read the trade discussions as there is a lot to learn by reading the posts. I've always tried to include rationale in my trade postings about why I think its a good setup. In addition to the official trades, I still plan on posting ideas in other forums such as Unofficial Trades (so for those new to following me, make sure you notice the difference between official trades and unofficial ones). Many hedged straddle trades that look good simply require too big of a trade allocation to fit anywhere near a 1K allocation, so these will go in unofficial trades.10 points
-
For what it's worth, thought I'd share my experiences for both the amusement and education of others. There should be nothing quite like hearing from another newcomer what it was like to jump headlong into trading the Steady Options strategy. So far, I have done (or messed up doing) the following: Went directly to trading with real money, although at the minimum allocation on every trade I have never been able to paper trade, it just doesn't simulate investing real money or hold my attention and everything that goes with it (but be prepared that you can and will probably lose money if you start this way) Have so far placed 31 trades, of which I closed 28 and made a profit of 2.7% overall I wasn't new to trading, which I think saved me, because I wouldn't have been able to deal with the ups and downs on zero experience My results would have been much better, except that I made the following mistakes Chased fills on calendars, particularly on Netflix, feeling desperate to get into the trade after it was posted (way too excited on the first few days) Later saw Kim's warning not to chase fills (woops) My losses on these trades were higher due to overpaying for the position in the first place Accidentally entered an Iron Condor or Iron Butterfly backwards on more than one occasion (I think this is easier to do than people might think) Accidentally had an expiring option assigned to me, noticing that all of the sudden I was short 100 shares of Starbucks in my account, and then I was unable to cover it for a few days, which cost me money - Track your expirations carefully, I thought I would never make this mistake and then wham! Decided to switch to Interactive Brokers from Fidelity, had my account locked up for three days, missed the exit on the QCOM trade, which cost me a big loss (I didn't realize the transaction of money to IB would happen immediately upon my request, then lock up my account) The entire transfer of money to Interactive Brokers failed because of this mistake - make sure you don't have expiring options that are less than 2 weeks out when you make a switch like this! Developed two trades on my own, based upon forum content - a BABA calendar trade and Disney hedged straddle, of which the BABA trade was a loser due to a big surge in the share price and the Disney was a nice winner And perhaps my biggest mistake, on the very first day with SO I saw we were doing a Netflix calendar with puts, so I thought we must be bearish on the stock and so I sold my regular stock position in Netflix, then later read the detailed description of calendar trades and realized it was all about capturing the decay of the shorter option against the longer one. I should have held on to my Netflix position! But as Jesse Livermore said, this is like a tuition fee for learning a lesson. I'm trading on top of an intense full time job, and I have found that I make mistakes when work is going crazy, even though I think I'm on top of things. So I guess the message is don't underestimate how confusing this can get when you have 10+ trades open at once and you are stealing 5 minutes out of your day to manage the trades. In the future, I will keep much more precise records and also probably limit the number of trades that I have open. So hey, bottom line, I have had a blast, learned a ton, and I didn't lose money! But now I realize this will take years to learn. I hope this is informative and/or amusing to someone. This is a great community. Thanks.10 points
-
Oh wow! I am speechless (and that's usually not one of my problems)! Thank you so much @Kim and Team! I am humbled to receive this recognition, which I honestly don't think I deserve... In fact, I'm just a returning rookie who's tried his luck with SO a couple of years ago, but back then lacked the right attitude, tools, time, and dedication necessary to succeed. This being said, I have learned greatly from the grandmasters at work here, and from the community as a whole. I have made a plan with milestones and desired outcomes for my second chapter with SO, and I will keep you posted about my progress... I'll try to give back to this community (our shared virtual trading room, if you will) to the best of my abilities. Finding SO was my door- and eye-opener into the world of option trading. I couldn't have wished for better companions along this inspiring journey! Thank you very much indeed! This has truly made my day!9 points
-
Member of the month award for June goes to @project for his excellent Implied Volatility posts.9 points
-
If I may post a contrasting experience to @yalgaar's... I am the newest newbie when it comes to options trading. After being a long stock investor for decades, I decided this year, after the crash, to figure out what options could do for me to provide a hedge. I did some free online courses, listened to a lot of podcasts, and then managed to lose thousands of dollars buying puts on a stock in an industry I am intimately familiar with, learning the valuable lesson (again, but with options this time) that the market doesn't care what a fair valuation is, and that it could stay irrational much longer than my options' expiration. I now realize this is a fairly typical entry for many a new options trader. I then sampled a few trade advisory services and then ended up here, intrigued of course by the returns, but also by @Kim's articles here and on Seeking Alpha. I joined SO in July. Since then I've done 7 trades: 6 official (BYND, UBER1, UBER2, LOW, BBY, BILI) and one unofficial (XLNX). Only one has been a loser (UBER2) My tips, all of which have been gleaned from advice from members here: 1) As everyone here seems to repeat Ad Nauseum, "Don't chase the entry!" For me, this means that if I can't get in within 2-3% of margin on official, I let it sit. From a post here I learned how to plot the strategy price so I can see it move during the day. I might place a day order for the first day, or even 1-2 days after the official notice, at the official price (or within 3% of margin if it looks like it will not go down), and then I just wait. If it doesn't get filled, I just walk away from the trade. As Kim has pointed out, the prices do sometimes go well below the official. 2) Once I get a fill, I immediately set a GTC close order because I'm on the other side of the world, and I can't be bothered to sit in front of the computer all night. For an earnings trade, if it doesn't get filled prior to the earnings announcement, I would plan on walking up before market close to close it, but I have not had to do that yet. My average GTC target has been around 10% return on risk, but I'm not stuck on that. Apart from SO, I'm playing with both VolHQ and ChartAffair, and I realize now that I'm going to need OptionNet to visualize potential trades better. I use IB but their option "Performance" visuals are lacking. But that is all I plan on getting. I am now reading books by Wolfinger and Augen, and I'm fully aware that this journey is going to take years. The more I learn, the more I realize how little I know. My results thus far: for the 6 winning trades I have averaged around 10% (unsurprising I guess given my target, but very surprising to me given that the average time in market was around 3 days per trade), and I lost 0.5% on the one loser. I'm glad to report that my first 2 months have more than paid for my subs! More importantly, I've learned A LOT in just a few weeks, and the curve remains very steep, but here I feel there's a culture of mentorship, something I'm going to need.9 points
-
Oh look the Monday morning quarterback. Death rate of the 50-60 range is 1.3% for men its about twice as high. So that would kill 1 in 50 men in that age category. So thats 200,000 dead men in that age category in the US - not that I am taking this personally because I am 53 or anything. Even bigger problem is that these 200,000 and in fact a multiple will require hospital care. There are currently 1,000,000 staffed hospital beds in the US - not even going into the ICU beds question - do you see a problem already? Sweden has 10M people in a very sparsely populated country with nowhere near the density of population even in its couple of bigger cities. Its also out of the way of major trade and traffic lanes and isolated by sea and unpopulated land areas. The population is also applying a level of self-discipline that is quite unlikely to be found in the US.The so called herd immunity is completely based on models and not on actual testing. They believe that for every confirmed case they have 75 unconfirmed ones but there is zero proof of that. in fact a more likely factor is 15 which is the normal transmission rate without measures. But even with the 75 factor they arrive at 23% immunised population in Stockholm (not elsewhere) which is not enough to be termed real herd immunity. I agree that the numbers touted of 60% are exaggerated but 35% (one third) really is a minimum. They are still by the most optimistic predictions 50% away from that by MID MAY. In the mean time they are accepting outsized death numbers in the higher age categories starting at 50. A second wave is unavoidable but prior experience shows that with measures in place you can contain it by isolating the cases. Which is what was successful in the predecessor MERS SARS cases but which this time around slipped out of our control. https://www.theguardian.com/commentisfree/2020/apr/29/us-responses-1918-flu-pandemic-offer-stark-lessons-coronavirus-now You might want to read that as real experience of what can and cannot be done. Herd immunity is a theoretical concept that does not take into account factors as health care and systemic stress from the deaths and ill people. Already now health care workers are struggling to stay healthy AND work double shifts to deal with the emergency. I agree that we should relax the measures as soon as possible but Sweden and New Zealand's example are about as logical as comparing the Swedish and New Zealand Stock Exchange to Nasdaq and NYSE.9 points


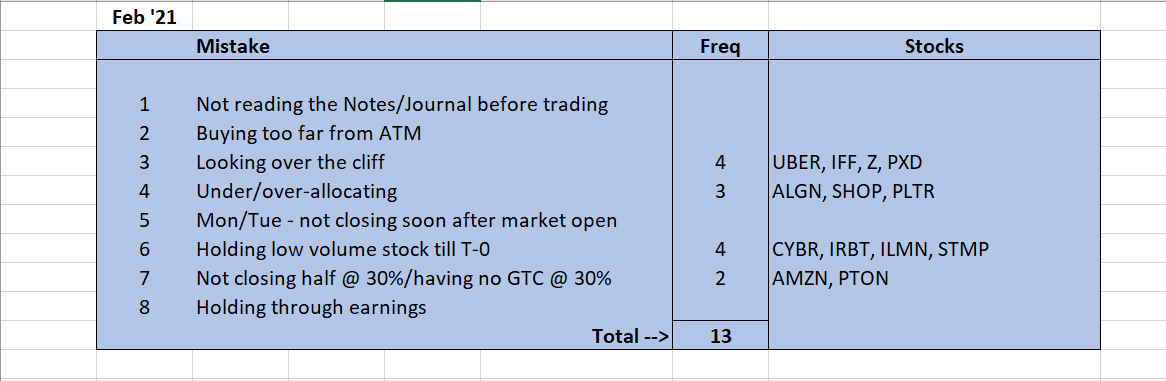


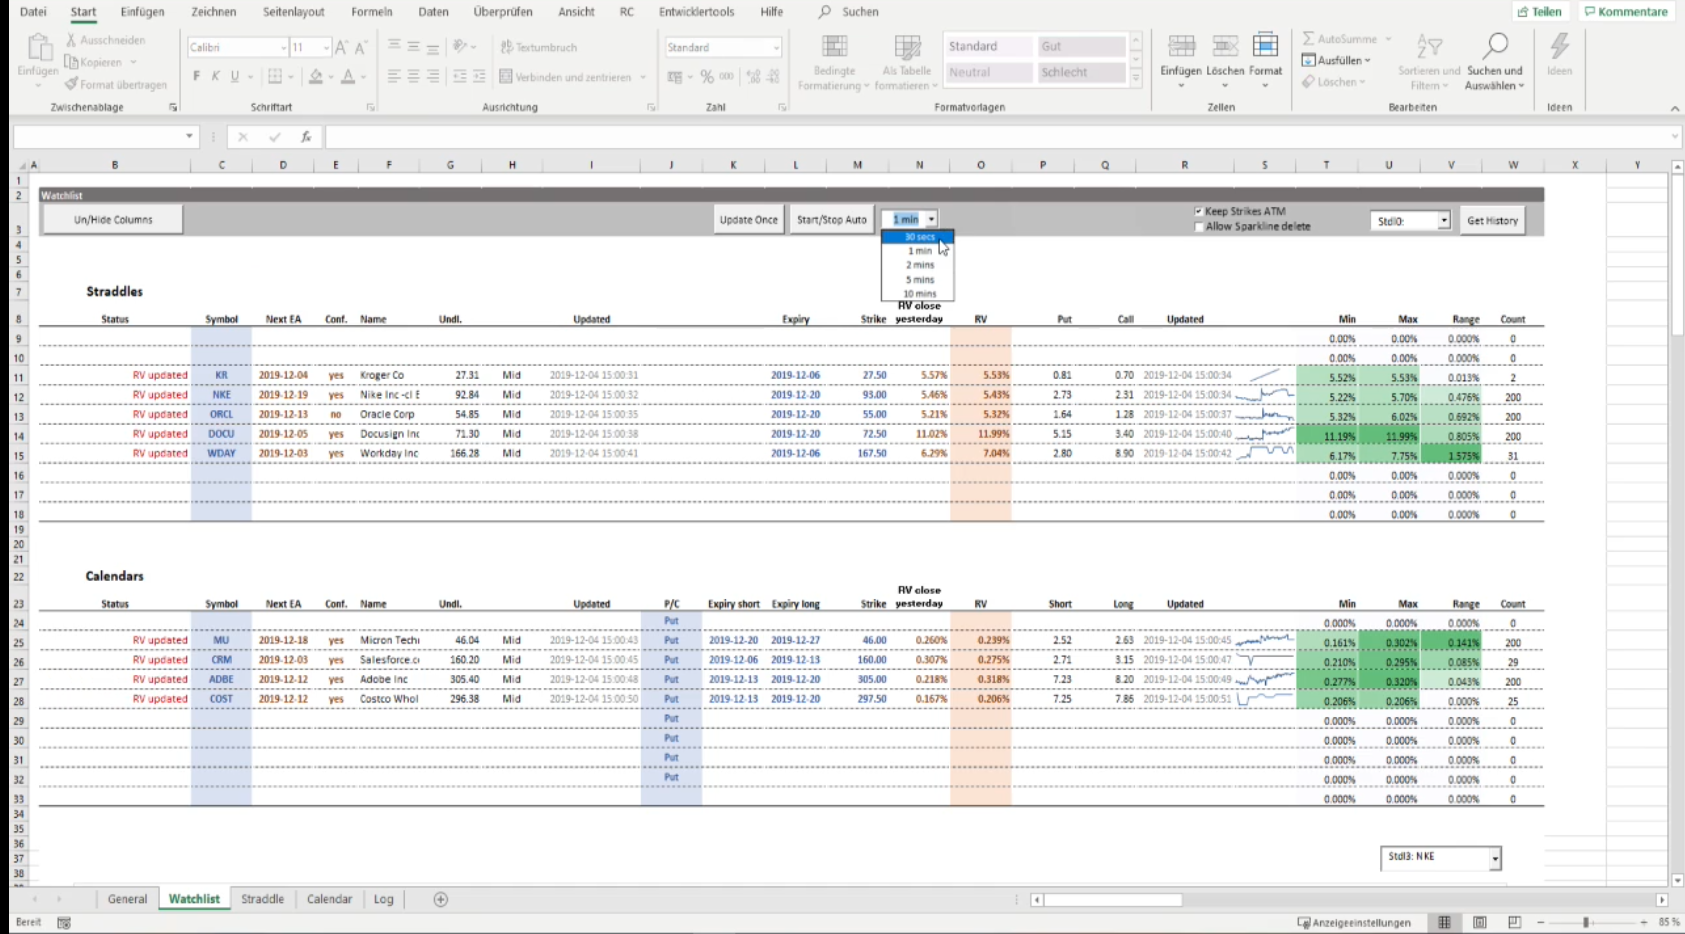


This leaderboard is set to New York/GMT-04:00