All Activity
- Past hour
- Today
-
 Nid joined the community
 -
 hellolulu joined the community
 -

No Really, It Will Be Different This Time Around!
TrustyJules posted a article in SteadyOptions Trading Blog
 As a Dutchman our country’s largest contribution to mankind is not the ASML wafer stepper essential to the tech bros but the even more essential ‘company limited by shares’. 16th century Netherlands invented the stock market, derivatives, futures, options and it also invented the stock market bubble. Practically from the onset of stock trading bubbles occurred, re-occured and fooled investors over and over again. There was never any real pattern to them. Promises of golden vistas in exchange for hard earned capital to be invested were a common part of it; as well as a general FOMO feeling which our ancestors suffered from as much as we do. To stay in more recent times, you dont even need to be much older than the average Gen-Zer to have gone through a bubble bursting and the dot-com, telecoms and other busts after years of boom are mere decades not centuries away. Why did we love tech companies? We’re not talking about the products – one can love them but as investors we have loved tech. Anyone that bought US$10,000 worth of NVDA back in 2016 would now be sitting on US$3 million not even counting dividends. Truth be told NVDA is an exceptional company but any investment in a FANG company would have yielded a 10-fold return over the period. We loved these companies because interest rates were low, they could create growth and value with little capital and even today the potential for market growth remains exponential. What is there not to love and why would this golden age of tech not endure forever? Capital the key expenditure What made the Dutch invention of a company limited by shares so successful is that it allowed pooling of capital to achieve things that individuals would find hard to do, borrowing against that capital for more and eventually also value creation in and of itself because a market comes into being by the mere fact of it being offered for the first time. The invention is not for nothing summarized as capital markets because capital is the key cost driver for any venture promising a return. The world is full of perfectly decent companies that have high capital cost and provide modest and predictable returns, utilities for example. Critically on the stock market we do not value them the same way we do tech companies exactly because cash-flow and capital costs are respectively low and high. The Hunt for Red October – Capital As of early 2026, the strategic priority for big tech has shifted from protecting free cash flow to securing the physical infrastructure required to dominate the next decade of compute. Five "Hyperscalers"—Microsoft, Alphabet (Google), Meta, Oracle, and Amazon—are currently engaged in an unprecedented (CapEx) ramp. In 2025, these companies spent a combined $448 billion on AI-related infrastructure. By 2026, that figure is projected to exceed $700 billion, representing a 60% year-over-year increase. For context, Amazon's projected 2026 CapEx of $200 billion alone exceeds the annual capital investment of the entire U.S. energy sector. Which as an aside is essential to AI data centres but gets less love than AI does. This shift reflects a move toward "front-loaded" infrastructure: building the data centers, power systems, and specialized silicon (GPUs) today to capture AI-driven revenue tomorrow. Company Avg. CapEx (2020-2024) Actual CapEx (2025) Projected 2026 Projected Avg. (2027-2030) Amazon $52B $132B $200B $215B+ Google $31B $88B $180B $190B+ Microsoft $28B $88B $145B $160B+ Meta $24B $72B $125B $140B+ Oracle $7B $21B $50B $65B+ Now you may think that is unprecedented but it isn’t. Back in the 2000 the telecommunications industry invested US$230 billion in OECD countries which is around US$ 400 billion in today’s money. The spending patterns a few years previous and after were similar to the above table. At the time the argument was the same – we need to invest because if we don’t we will miss the mobile telephony boat and basically whatever future there is. What really happened was that overcapacity was built which took decades to absorb (although it did create the dot.com boom thereafter). Look at that chart – it’s the future for the average AI company once the smoke clears and the investment madness fades. AI is wonderful – just like mobile telephony is but it must still obey the commands of the capital markets. An old saying goes that military amateurs watch armies, military generals watch logistics (you see how I managed to crowbar Red October in there?) – cash flow will dictate the value of companies, same as until today Big Tech made us all happy with big free cash flow for little capital cost. Free cash flow is not free Big Tech was a "light" business model—software had high margins and required little physical capital. AI has flipped this script. Free Cash Flow (FCF) is now under significant pressure as operating cash is diverted into property and equipment. AMZN provides the clearest example of this strain. Despite record operating income of $80 billion in 2025, its FCF plummeted from $38 billion to $11 billion (a 71% drop) due to a $128 billion splurge on property and equipment. As we enter 2026, analysts anticipate several of these firms—specifically AMZN and very likely ORCL—may dip into negative FCF territory as they tap debt markets to fund the infrastructure build-out. Valuation and capital efficiency are inextricably tied Investors are grappling with how to value these companies in a high-CapEx environment. The traditional Price/Earnings (P/E) ratio is being augmented by the Price-to-Capital Expenditure ratio as a measure of how much "future growth" investors are paying for relative to the cost of the hardware required to generate it. While P/E ratios have compressed since the 2021 tech bubble (with Amazon dropping from 64x in 2021 to roughly 33x in 2025), the forward-looking P/E remains elevated compared to historical norms, as the market bets that AI will eventually drive a massive expansion in net income. Here is an overview of P/E and P/Capex for big tech: So the forward looking P/E is looking as it should gradually lowering but not the price/capex ratio which is climbing steadily. In practice this means Big Tech will be generating less cash and become a kind of AI utilities. What does this mean? Capital Intensity: Big tech companies will effectively become "digital utilities." The barrier to entry for AI is so high that only those willing to spend $100B+ annually can compete. You don’t see new telcos either! Amortisation, the silent killer: while EBITDA might remain high, the P/E ratio is calculated using Net Income, which is heavily weighed down by that depreciation—this is the "accounting trap" that makes capital-heavy companies look more expensive than they are on a cash basis. Cash Flow Strain: For the first time in a decade, Big Tech is tapping into the debt markets (issuing over $130B in bonds in 2025 alone) to fund operations, as internal cash is entirely consumed by hardware. The ROI Clock: The market's tolerance for depressed FCF is not infinite. By 2027, the focus will shift from capacity to utilization (see figure 4) —if the revenue growth doesn't follow the capital curve, we will see a massive re-rating of these "A(I)-list" stocks. Tech to utility Among the ugliest ducklings in the market of these latter years are utilities and yet paradoxically the tech bros are doing everything to transform themselves from swans to ugly ducks. The cartoon is a joke but like any joke it has a core of truth. Tech will be moving to utility type valuations but conversely utilities are going to move in the opposite direction towards tech valuations. This really changes a fundamental understanding of the reason for high tech p/e multipliers. Energy providers to AI are now growth stocks fuelling the digital utility sector. The "Danger Zone" If a company has a Price-to-CapEx ratio that is falling while its P/E ratio remains high, it suggests the market is still pricing it like a nimble software company even though it is spending like a heavy industrial utility. That gap is where "valuation corrections" usually happen. When Big Tech was "capital light," their high P/E ratios were justified by a high Return on Invested Capital (ROIC). They could grow revenue by 20% by simply hiring more engineers (OpEx). Now, they must spend billions on physical infrastructure (CapEx) just to maintain their competitive position. Worse whilst engineers and software is mobile and relatively hard to regulate, physical assets are not. They do not grow legs and are within reach of regulators wanting to tame excesses of the AI industry captains. The New Reality Capital Intensity. If Microsoft’s capital intensity jumps from 10% to 25%, its valuation multiple must compress because it now takes $2.50 of investment to generate $10.00 of revenue, whereas it used to cost only $1.00. Interest rates matter. Previously, rising interest rates hurt tech stocks primarily through the Discounted Cash Flow (DCF) model—future earnings were worth less in today's dollars. Now, interest rates are a direct operating costs. High rates now act as a "tax" on big tech physical expansion. A 5% interest rate on a $100B data centre build-out adds $5B in annual "carrying costs" that didn't exist in the 2010s. One is allowed to use the word paradigm-shift only sparingly but this is one. When a company becomes capital-intensive, it starts to get valued on Enterprise Value / EBITDA or Book Value, rather than just P/E. As these companies build hundreds of data centres, their amortizations will skyrocket. Since P/E is based on Net Income (their P/E ratios will look artificially high even if their stock price stays flat, making them look "expensive" for years. Mighty are the fallen as they say, anyone remember Vodafone? – the granddaddy of all the telco moguls whose valuation went through the roof and has since been struggling for decades as overcapacity, capital expenditure and poor cash-flow has hamstrung its share price. The table below the chart is written with Big Tech in mind but it certainly affected Vodafone in an almost identical way. Figure 1 Vodafone chart since launch late 1980s Comparison: Capital Light vs. Capital Heavy Era Metric Software Era (2010-2020) AI/Infrastructure Era (2025-2030) Primary Driver User Acquisition / Ecosystem Compute Capacity / Power Access Balance Sheet Cash Rich / Asset Light Debt Increasing / Asset Heavy Valuation Anchor Price / Earnings Growth (PEG) ROIC / Free Cash Flow Yield Interest Sensitivity Moderate (Valuation only) High (Valuation + Funding Cost) How about selling spades during the gold rush? Remember NVDA we mentioned at the beginning? Jensen Huang its president had a glorious customer day earlier in March. Anyone investing in the people that supply the AI are sure to benefit and investors may believe their salvation will lie there. The "hardware suppliers" (Nvidia, AMD, Micron, TSMC) are currently in the most lucrative "Golden Age" in the history of semiconductors. However, the semiconductor industry is notoriously cyclical something that is backed by decades of economic data, and the current AI-driven "super cycle" is creating the mother of all supply-demand imbalances. The Concentration Risk: a massive portion of revenue for companies like AMD and Nvidia comes from just five customers: Microsoft, Google, Meta, Amazon, and Oracle. The supply chain (TSMC/Micron) is currently building factories specifically to meet their demand, any tapering from these five "whales" will create an immediate and massive supply glut. Their future is inextricably tied to their customers ROI from hyper scaling activities. The Capital Intensity Paradox: To meet Big Tech's demand, hardware suppliers are being forced into their own "CapEx Arms Race." Micron: Just reported 2026 CapEx projections of $30 billion—a staggering 50% jump—to build High Bandwidth Memory (HBM) plants. The Risk: Semiconductor fabs take 3–5 years to build and cost $15B–$20B each. If demand tapers in 2028, but the factories planned in 2025 are just coming online, these companies will be hit with massive amortisation costs on underutilized assets. This is the classic "Bullwhip Effect" that historically leads to deep net losses in the chip sector. Comparison: Historic vs. AI Supercycle (2020–2030) Metric PC/Mobile Era (Pre-2022) AI Supercycle (2023-2026) The Taper (2027-2030) Inventory Cycle 18–24 months 36–48 months (Extended) Potential Surplus Client Base Fragmented (Consumers) Concentrated (5-8 Firms) Enterprise/Sovereign AI Margin Profile 40% – 50% 70% – 80% (Nvidia/HBM) Compression toward 50% All ye mortals see my prediction and shudder in fear When the orange line (CapEx) stays high while the blue line (P/E) starts falling (2026-2027), it indicates the market is pricing in a "Bust." hardware suppliers become "cheaper" (lower P/E) as their CapEx rises, because the market fears the "Peak" has passed. The problem of the AI suppliers is the same as that of Big Tech – once you build capacity (or AI) you have to ‘use it or lose it’ and the price is no longer a consideration as 1$ is more than 0$. If you believe you can charge monopoly prices you will find the regulator in your way with anti-trust/competition rules. Is there really no reason why things should be different this time? Beyond the hype and the massive (over) capacity building that AI companies are doing we should be cautious about not dismissing it altogether. After all the faithful telecommunication companies that were once stars in the heavens are still with us here on earth. Tech companies have P/E valuations in the 30s whereas utilities have them in the mid-teens. The change in how utilities are priced after decades of being disregarded is telling in this respect. Capital Intensity: Big Tech mirrors the utility sector, requiring massive ongoing investment to maintain competitive advantage. Cash Flow: Short-term FCF is being sacrificed for long-term "Total Addressable Market" (TAM) capture. Valuation: Multiples are increasingly tied to "AI Proof of Concept"—if the revenue from Gemini, Azure AI, and AWS Bedrock doesn't materialize by 2027, the current CapEx levels will be viewed as a historic capital misallocation. As the song by Racey goes, ‘Some girls will, some girls won’t’ and so it will be with AI investments. AI has foundational utility much like electricity; so LLMs can continue to scale as long as they meet more than consumer whim. Nevertheless for Big Tech by the end of 2027 some ROI has to show up or we shall see a bust as historic as the boom we are experiencing. This is what is historically known as the bull-whip effect in semi-conductor manufacturing. Timing the market is impossible and certainly you shouldn’t start shorting big tech at this time – just be aware that a reckoning will come. When it happens people will argue it is the end of time when in fact it will simply be a healthy reset where capital markets assert their supremacy on whatever business model is thrown at them. A last word returning to the mother of all stock market companies: the Dutch East India company was quoted for almost 200 years. It is still the most valuable company of all time at its peak but the overall return for someone that held them from day 1 to the last trading day in 1800 was... 5% per year. So no, it is not different this time.
 - Last week
-
 Cobra808 joined the community
 -
 DEAN joined the community
 -
Absolutely! Simple spreads is using debit spreads, no margin involved, and commissions are much less critical because most of the spreads are higher dollar value, so commissions are small percentage of the spread value.
-
Hi, I have a broker account with Tastytrade. Unfortunately, Interactive Brokers declined to give me an account. The margin interest is lower with Interactive Brokers and I wanted to know if Simple Spreads was still viable using Tastytrade? Thanks
-
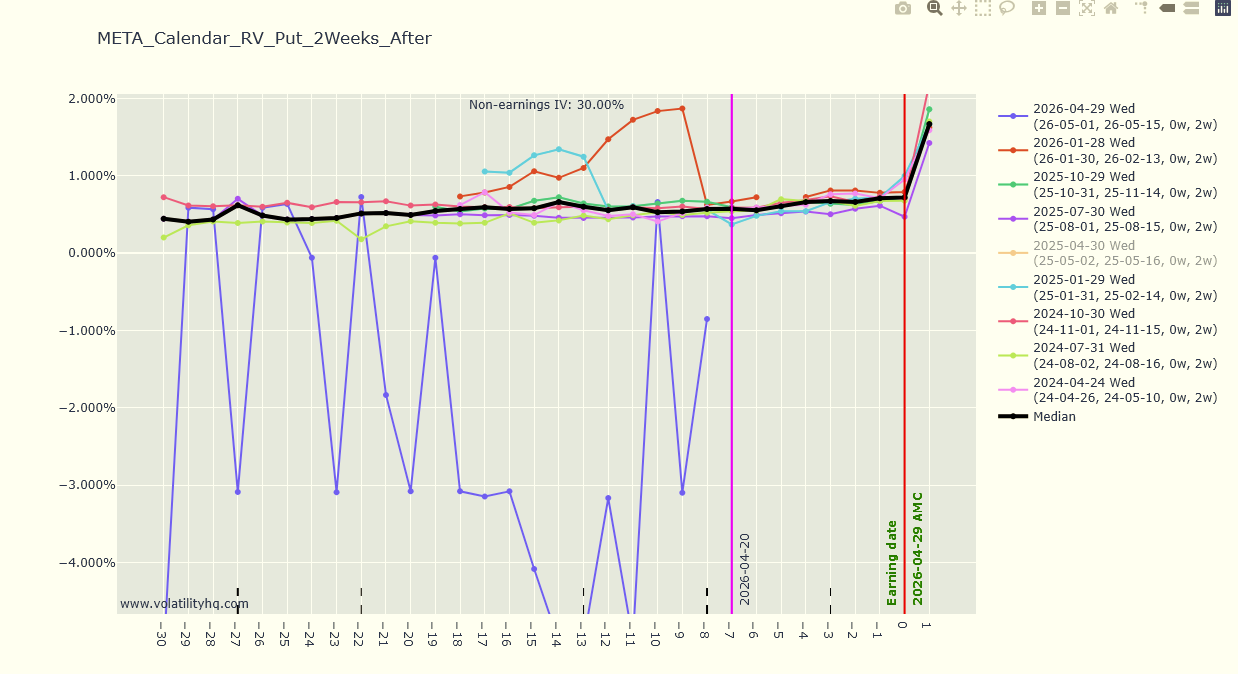
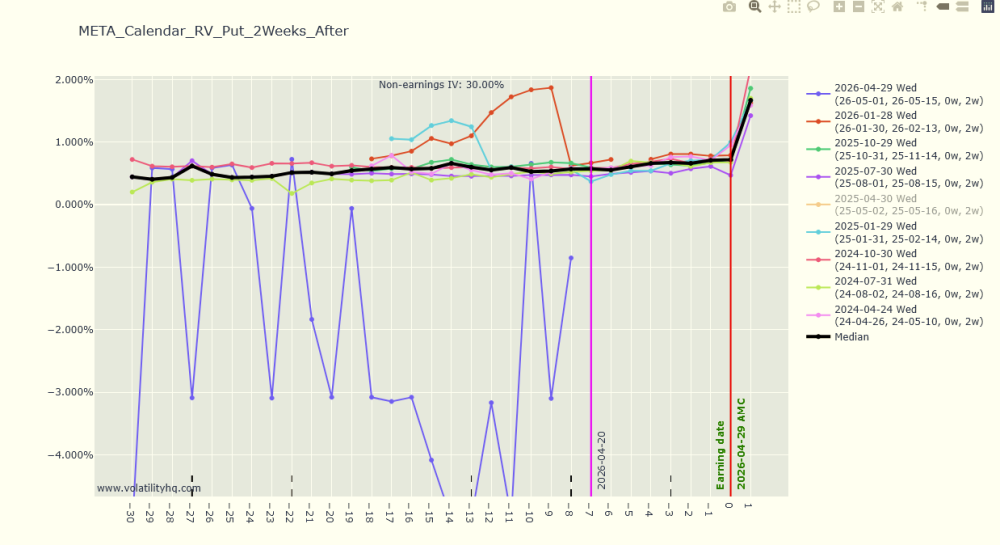
Thanks. It looks better, but the values are off, at least for the current cycle. Yesterday's (T-7) closing RV is showing as 0.55%, when it would have been around 0.67% (670 2-week Put Calendar @4.50) T-8 is showing 0.195%, when it was actually around 0.66%. Just passing along my observations. No rush at my end as I can work around the problem.
-
I think it is specific to META, because there was some confusion in the code that it was trying to retrieve the stock price of FB instead of META sometimes and sometimes it was getting it from META. I think the RV calendar of META should be better now. I've added an override for GE, but just to be clear, it is the responsibility of each trader to confirm the earning date / time by looking at the official investor relations website. That is the only source of truth.
- 1116 replies
-
- 2
-

-
- rv chart
- volatilityhq.com
- (and 1 more)
-
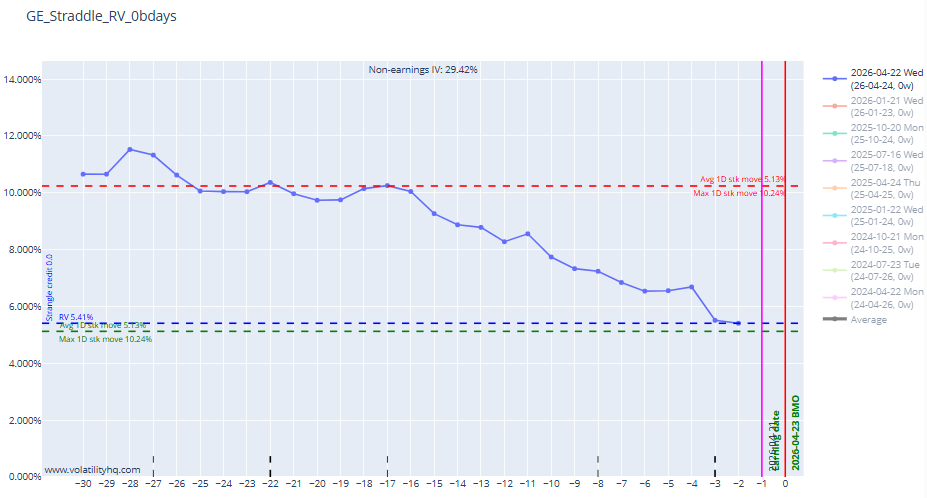
@Djtux GE reported today BMO Please over-ride if possible so that nobody opens a play by mistake taking today as T-1
-
Check your PM please, those matters are better discussed privately.
-
Hi, I wanted to pay my subscription renewal via credit card, but my PayPal payment method was not setup correctly. I've now changed it to pay via credit card. Would you please credit my bank account for the payment that just processed, and request the payment via PayPal? Thanks in advance
-
 livinglegend joined the community
 -
@Djtux - New convert to VolHQ, so please excuse my ignorance. The Calendar chart for META seems wonky. The scale is centered at 0%, causing the current cycle RV to show negative. Other tickers (AAPL, TSLA) seem OK. What am I doing wrong ?
-
 gher joined the community
 -
 Sunnym408 joined the community
 - Earlier
-
 kairos joined the community
 -
I'm not sure if someone is still using that, I believe it was one of the strategies used on SO at one point. The long strangle strikes are the closest to ATM strike + or - the short straddle premium
- 1116 replies
-
- 1
-
-
- rv chart
- volatilityhq.com
- (and 1 more)
-
@DjtuxCan you please which deltas are being used for this OTM long in Backtesting Test?

-
 dzumwalt joined the community
 -
 raineorshine changed their profile photo
 -
The earning date override doesn't work in this case, i'm not sure why for the moment. I am trying to rerun the calculations as the cache is stale.
-
@DjtuxAlso, yesterday's values are not in yet for all tickers. Please take a look at that as well
-
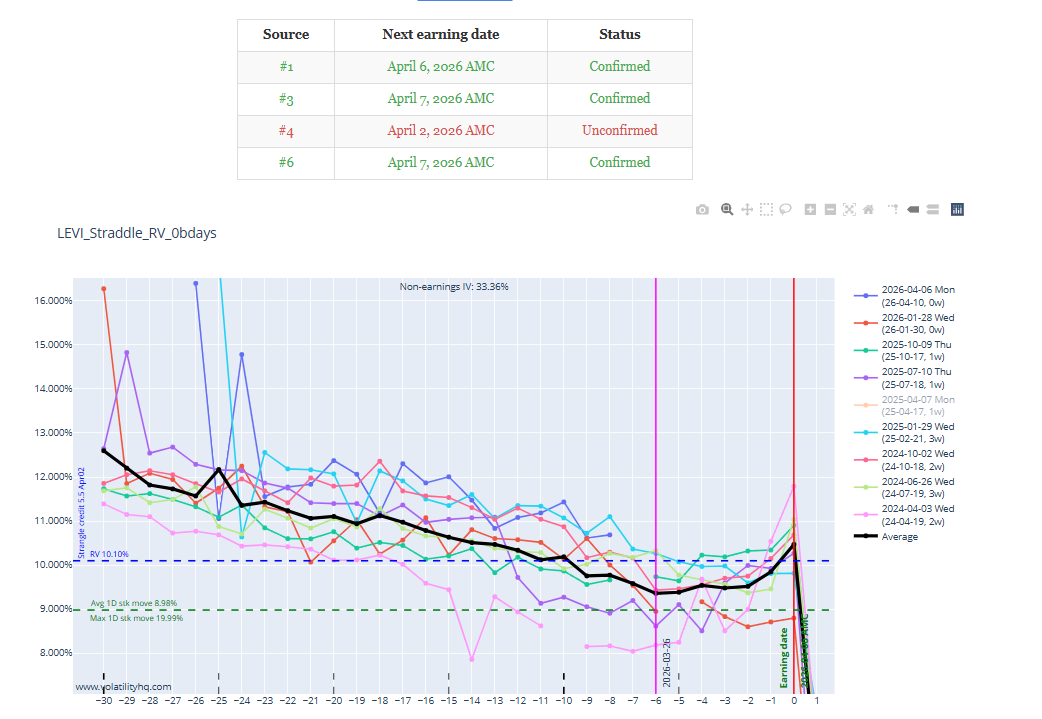
@Djtux For Levi, the company has confirmed on April 7 AMC but the tool is using April 6 AMC. As you mentioned before, the tool is configured gives the hightest priority to Source 1 when confirmed vs Others. So, please make the appropriate override or as you see fit. https://www.businesswire.com/news/home/20260324931741/en/Levi-Strauss-Co.-To-Webcast-First-Quarter-2026-Earnings-Conference-Call https://investors.levistrauss.com/events-and-presentations/events-calendar/default.aspx

-
I think I found a workaround. The calendar rv should be up to date.
-
I think the problem is the code that handle the earning source override is not robust enough so it is causing issues you see and also the rv is missing a few days. Sorry about that, i will plan a fix in the future to make that more robust, but it’s not a quick fix, sorry about that.
- 1116 replies
-
- 1
-
-
- rv chart
- volatilityhq.com
- (and 1 more)
-
@Djtux NKE was working earlier this morning, the error message is recent.
-
Yup, BABA as well, where I observed
-
Is it for NKE alone or for other symbols as well?
-
@DjtuxIntermittent issue today:
-
Yes, that's right. Makes sense now as to why Apr10 was used. Thanks for the override!
-
I don't have the option chain right now, but isn't April 3rd closed for good friday ?
-
Yup, that fixed it. However, note that the two dates of March 31 and April 2 are both encompassed by the April3 expiration so no matter what date was used the RV charts should use the Apr3 expiration - neither of those 2 dates should have caused it to use Apr10
-
That’s because source #1 is the priority source when it is confirmed. They still display April 2nd while source 4 and 6 display March 3. I have set a temporary override to for NKE to use source 6 (march 31). Please let me know if that fix the issues?