All Activity
- Past hour
-
In case you haven't seen it - https://steadyoptions.com/articles/the-last-14-minutes-why-we-stopped-looking-at-options-closing-prices-r837/ The tool now presents 3:46 data rather than closing quotes. This is a game changer. We can now see much more realistic quotes, especially for less liquid options with wider spreads.
- Today
-

The Last 14 Minutes: Why We Stopped Looking at Options Closing Prices
Kim commented on krisbee's article in SteadyOptions Trading Blog
@krisbee this is a game changer! We all know how unreliable the closing quotes can be, 3:46pm data provides a much better overall picture. -

 What happened was the front leg's closing quote: it blew out to $4.70 wide — and dragged the computed mid far enough to nearly double the measured debit, and with it the relative volatility reading: 0.55% became 1.00%. Two trading days later, on Monday, August 10, the close showed the other way a late snapshot drifts. RV always measures whichever strike is at-the-money at the moment of the snapshot — that's by design. In the final minutes the stock moved about half a point, so the closing snapshot's ATM landed one strike higher (275 instead of 270), where the calendar is structurally smaller. Fine so far. But then the closing quotes — more than $4 wide on the front leg — squeezed that calendar's measured value to $0.10, when the pre-close market had priced the same 275 calendar at $0.40. Stack the two effects and the close printed an RV of 0.10% against the pre-close reading of 0.50%. A jumpier anchor, measured through sleepier quotes. None of these numbers was a bug — we reproduced all four from the raw quote records before publishing this. They are what the two snapshots honestly reported. The difference, in every case, was fourteen minutes. Notice what the two distortions have in common besides their timestamp: one direction each way. The close didn't lean bullish or bearish on volatility — once too high, once effectively zero. And the Monday case generalizes: across the symbols we have re-verified so far, on about 1 in 18 entry days (5.6%) the closing snapshot anchored to a different at-the-money strike than the pre-close market did. Once you understand why the final minutes can do that, you understand something important about every backtest, every screener, and every "is this expensive?" judgment you have ever made from end-of-day options data. Note: This feature of “4pm compare” retires from the app after a couple of months. What actually happens at 4:00pm Most of us grew up treating the closing price as the official price — the number the newspaper printed, the mark your broker settles to. For stocks, that is roughly fair: the closing auction concentrates enormous volume into a single, hard-to-manipulate print. Options are different. An option's "price" on an end-of-day file is usually the midpoint between the last bid and the last ask — and the final minutes of the session are precisely when that midpoint is least trustworthy. Market makers carry every open position overnight, through whatever news lands after the bell, so as the close approaches they protect themselves the only way they can: they widen. Quotes that sat a few cents apart at 2pm can be several times wider at 3:59. Attention shifts to the closing auction in the underlying shares. Some quotes go stale; a few cross or collapse to nonsense for a moment. The market is not wrong at 4:00pm — it is simply half-asleep, with one eye on the exit. Measure a relative-volatility ratio, a spread-cost figure, or a backtest fill from that half-asleep market and the noise flows straight into your numbers — twice over. The wide quotes wobble every mid. And because "at the money" is defined by where the underlying sits at the snapshot, a late drift can hand the measurement a different anchor strike — correct by definition, but jumpier in the noisiest minutes of the day. Most of the time the distortion is modest. Sometimes — as our ADBE chart shows — it is enormous. And you cannot tell which kind of day you are looking at from the number alone. This is not a novel observation; it is why professional options-data vendors have long sampled the market before the close rather than at it. The industry's quiet consensus is that a quote captured while market makers are still competing beats a quote captured while they are packing up. When the close lies most: look at the calendar Now look at when our two ADBE distortions happened, because the timing is not random. The August 6 spike was the Thursday close immediately before Friday morning's jobs report. The August 10 crater sat at the Monday close heading into CPI week. Both distortions landed at closes adjacent to major macro releases — which is precisely when you would expect the final minutes to be at their worst. A market maker going home flat-footed into a jobs number or a CPI print has every incentive to quote defensively into that bell; the overnight risk they are pricing is at its maximum. The quotes are widest, the mids wobbliest, exactly on the evenings when an earnings trader most needs a trustworthy reading — because those are also the evenings you are deciding whether tomorrow's setup is cheap. This is why the RV charts draw the macro calendar directly onto the time axis — the JOBS, CPI, PPI, FOMC and PCE flags you see running along the top of every chart. A strange-looking reading next to a macro flag has a candidate explanation you can see at a glance; a strange reading in the middle of a quiet week deserves more suspicion. The pre-close snapshot removes most of the distortion. The macro overlay tells you where to be careful about what remains. The two features were built separately, but they answer the same question from two sides: can I trust this number, tonight? Why this matters more for earnings traders than anyone else Earnings trades live and die on small edges measured over short windows. When we ask "is this straddle cheap against its own history?", we are comparing today's price to a median built from dozens of past snapshots. If a meaningful fraction of those snapshots were taken from a distorted market, the median itself is polluted — and a setup can look cheap or rich for no reason except closing-quote noise on a handful of historical days. It also matters at the moment of action. Members who use the Daily Screener know the workflow: the screener surfaces the day's candidates, you pick your structure, and then you have to actually get filled. Under 4:00pm data, there was always an honest gap between the reference price on the screen and the market you would meet the next morning — the printed mid sat inside a spread you knew had been artificially wide. In practice, many of us (myself included) compensated by scaling in: several limit orders at different prices, using the fills themselves to discover where the real market was. That works, but it is a workaround — you are burning patience and partial fills to rediscover information that a better measurement would have given you upfront. A snapshot taken fourteen minutes earlier, while the quote competition is still alive, closes much of that gap. The reference mid is nearer to a price someone would actually trade with you. Spread-cost readings reflect the market you can participate in rather than the market's closing yawn. And the historical medians your judgment leans on are built from cleaner raw material, cycle after cycle. To be precise about what this does not do: it does not make any strategy win more often, and it does not turn a mediocre setup into a good one. It makes the measurements honest. What you do with honest measurements is still up to you. What we changed, and how you can audit it Starting this cycle, EarningsStudy computes relative volatility from a 3:46pm pre-close snapshot instead of the 4:00pm close. The migration is deliberately gradual — current-cycle symbols with earnings in the next 30 days first, earlier years following after verification — because when you change the ruler, you re-measure everything carefully before you trust it. And rather than swapping numbers quietly, we built the audit into the product. On the Calendar and Straddle pages you will find a 4:00pm compare checkbox: solid lines show the new pre-close data, dashed lines show the legacy close-based data for the same symbol, strategy, and cycle. On most names, most days, the two hug each other — reassurance that the history you have been using was broadly sound. And then there are days like ADBE's August 6 and August 10, where the dashed line spikes to a peak, then falls off a cliff, that the pre-close market never showed. Every one of those divergences is a day the old ruler would have misled you — and every one is now inspectable, down to the raw quotes, because we keep both snapshots until the verification is done. One honest caveat while the migration runs: until the historical backfill completes, some today-versus-history comparisons mix a 3:46pm present with a 4:00pm past. The differences are usually small, but they are not zero — which is exactly why the compare view exists and the legacy snapshot is preserved until every cycle is re-verified. If you find a divergence that looks strange, the Ask button inside the app sends it straight to me with the page attached; several members' reports have already sharpened the verification. The part I care most about This upgrade exists because a member insisted on it. @Bhavan1986 made the case that the closing snapshot wasn't good enough — and he was right. When I brought it to the contributors, @Kim, @Yowster and @TrustyJules backed it without hesitation. The better data roughly doubles what we pay for market data, and we are absorbing that rather than passing it on: nothing changes about any member's current rate. That is what the SteadyOptions–EarningsStudy partnership is for — the tools this community trades with should keep getting more honest, not just bigger. It sits in a line with the spread-cost column, the confirmed-date badge, and the per-cycle detail behind every median: the platform's job is to show you numbers you could actually have acted on, not numbers that flatter a backtest. Measuring the market while it is still awake is one more step in that direction. SO members on the All-services bundle: full core access to EarningsStudy is free through the partnership — sign up at earningsstudy.com with your SteadyOptions email. The rest can subscribe at an incredible introductory price of $39.99. EarningsStudy provides educational research and market information only — not investment, financial, or trading advice. Options trading involves substantial risk. Backtests and calculations may contain errors and should be independently verified.
 -
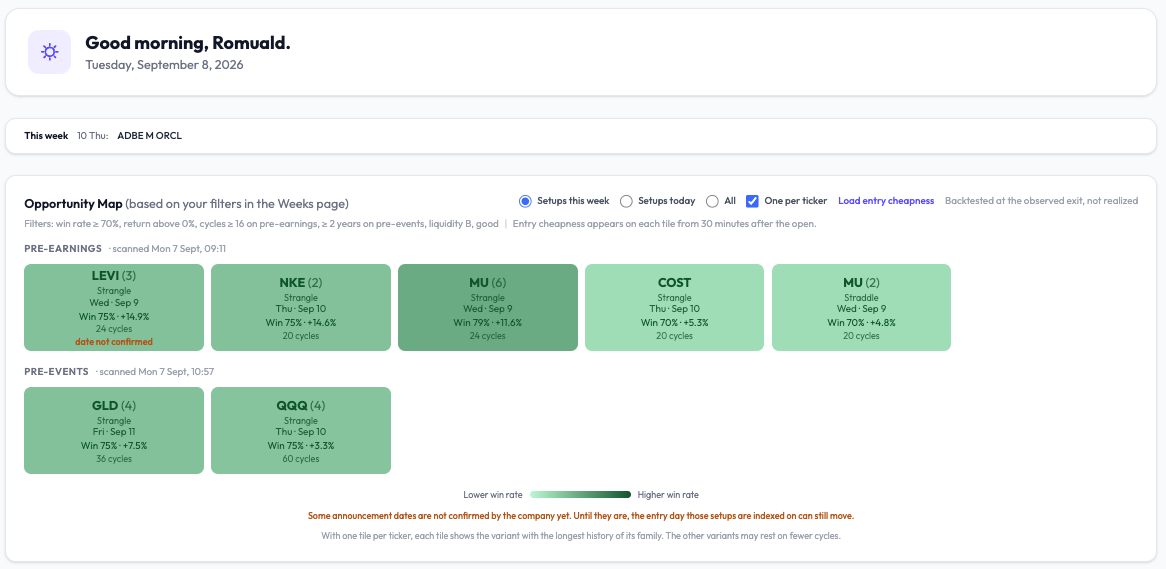
Added: unconfirmed earnings dates are now marked on the tile. Following a point raised here yesterday — a setup indexed on an announcement date the company has not yet confirmed now carries a marker, both on the Opportunity Map and in the scanner rows. LEVI is the current example. Its 30 September date is not confirmed, so the T-15 entry day the setup is indexed on can still move, and every T-x with it. The flag itself is not new — it comes from the data feed leaving the report-time field empty, which is what an unconfirmed date looks like there. What was missing was surfacing it where a setup is actually read. That is fixed. Two things worth saying about why this matters beyond the display. If a date moves by several days, every entry and exit day on that cycle points at the wrong event. That is the obvious half. The less obvious half: a backtest that enters at T-15 uses the announcement date we know now. If that date was only confirmed at T-9, the trader standing at T-15 did not have it. Every pre-earnings backtest that indexes on the final known date carries that, mine included. Marking the live case is straightforward; measuring the historical version needs a source that archives when each past date became confirmed, which I do not have.
- Yesterday
-
 Jman joined the community
 -
 Meo joined the community
 - Last week
-
 jim_swallow91 joined the community
 -
Yep, hostile market conditions are a real thing, and they expose whether someone is trading a robust process or just a strategy that worked in one regime. A lot of traders confuse “this has an edge over time” with “this should work right now,” and that gap can be painful. I also agree on sizing down or sitting out. There’s no rule that says we must trade every week or every setup. Preserving capital and confidence during rough patches is part of the game. Sometimes the best trade really is no trade, especially when execution quality starts slipping because the market feels chaotic.
-
Yes, that’s a very common trap. The market always gives you something to look at, and platforms make it very easy to act on every little move. But “easy to trade” and “worth trading” are two completely different things. Reducing trades is underrated. A clear setup, defined risk, and a position size that lets you stay rational usually matter more than finding another market or indicator. In my experience, the best filter is often asking before entry: “If this trade loses, will I still think it was a good trade?” If the answer is no, it probably wasn’t a real setup.
-
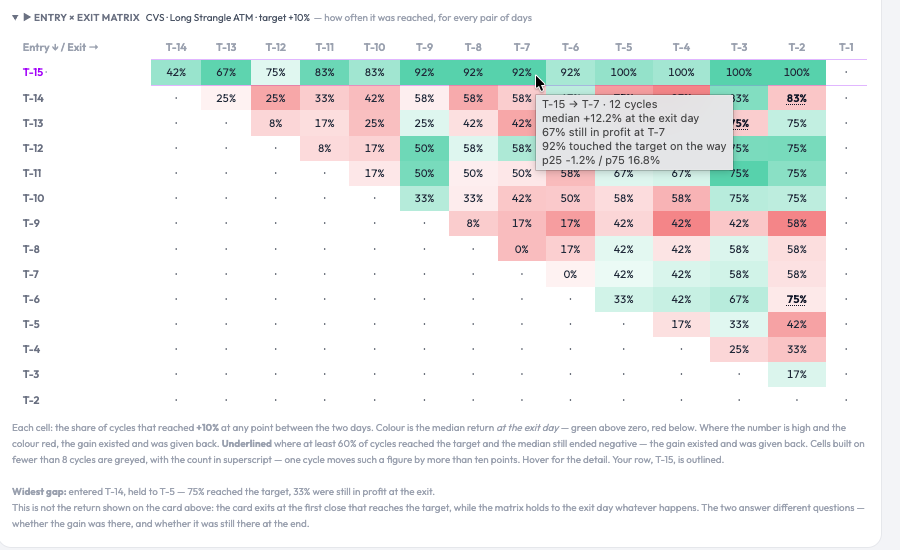
New in OptionBench: the entry × exit matrix Pre-earnings scanners tell you what a setup returned. They rarely tell you when the return was there. I've added a matrix to the pre-earnings detail view — entry day down the side, exit day across the top. Each cell shows how often the target was actually reached between those two days, with the colour carrying the median return at the exit. The two numbers diverge more than I expected. On a CVS strangle entered at T-15 and held to T-8, 92% of cycles touched +10% on the way and 67% still held a gain at the exit. On AAPL entered T-15 and held to T-3, it's 75% against 25% — three cycles out of four offered the gain, one in four kept it. That gap is the argument for a take-profit, and I hadn't seen it stated in one figure anywhere. It reverses on a Calendar Put: 46% still in profit at the exit against 25% that touched +20%. A short-vol position drifts up on theta rather than spiking, so it rarely overshoots. The reversal is what tells you the gap belongs to the structure rather than to the arithmetic — checked on AAPL, AMD, NVDA, MU and CRWD. Cells built on fewer than 8 cycles are greyed with the count in superscript. On seven cycles a percentage can only take eight values, and one cycle moves it by 14 points. It's live now on the pre-earnings scanner, https://app.optionbench.com/dashboard/pre-earnings-scanner, pre-events tomorrow. Happy to hear where it's wrong.
-
😂 Dave has broken nothing. Dave has found things — which is worse, because then I have to fix them. Three in one week. At this rate I'm putting him on the payroll or blocking his account, I haven't decided! Now I'm back, come on Dave, still waiting for your questions ...
-
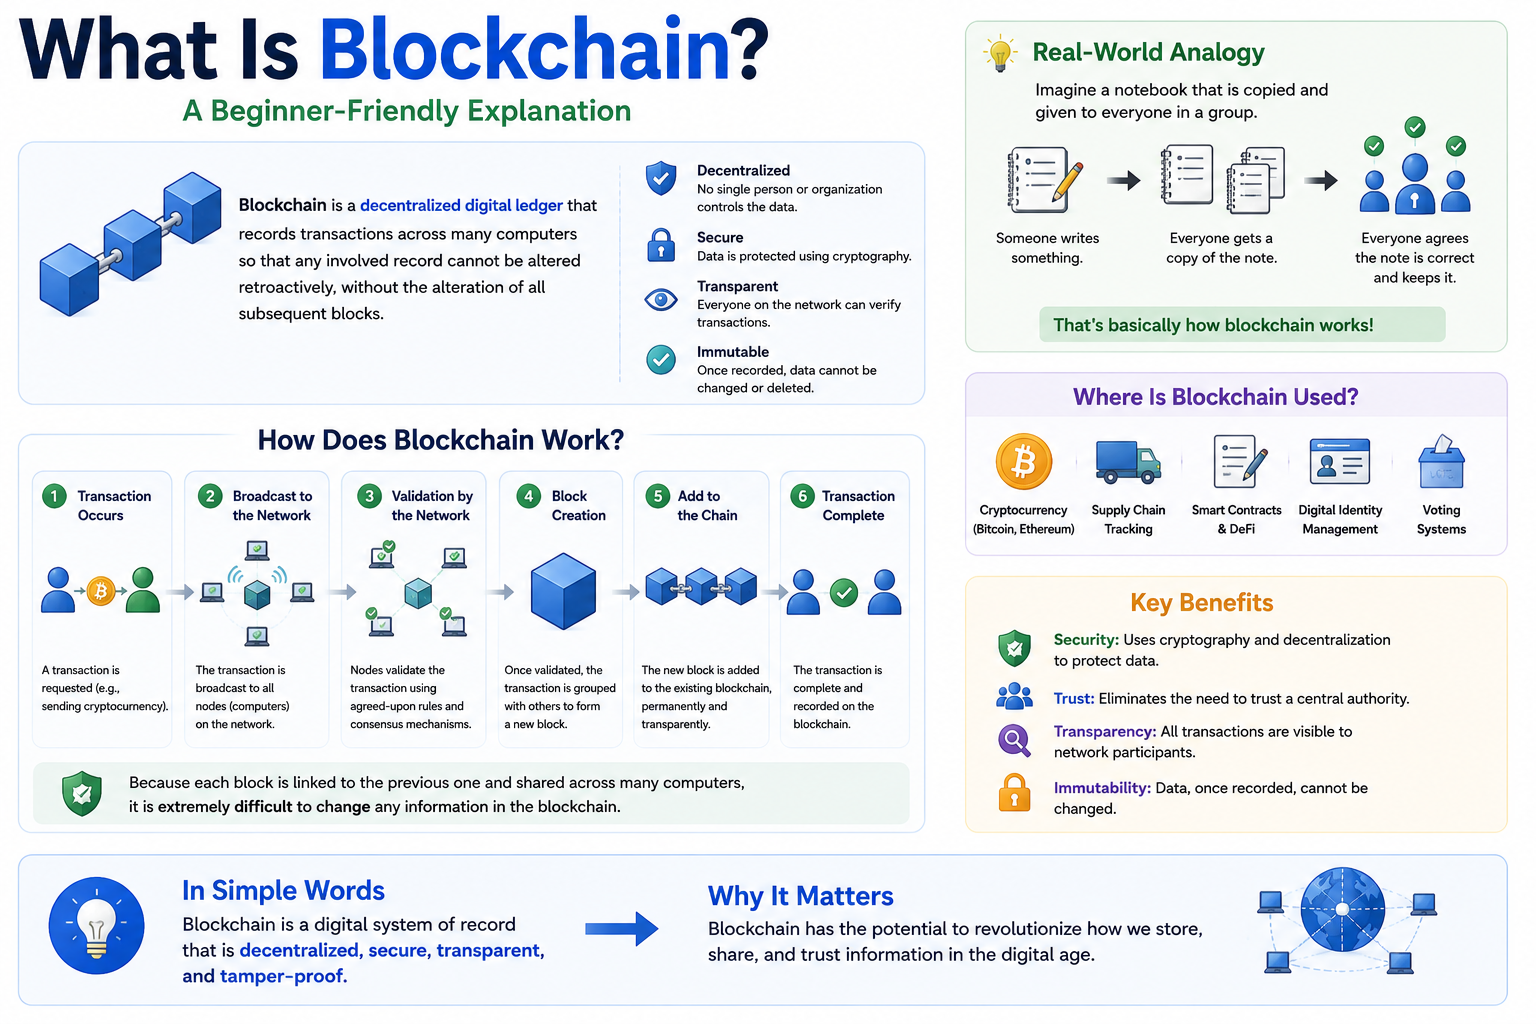
 What Is Blockchain? Blockchain is a type of digital record-keeping technology that stores information in a shared network rather than in a single central database. At its most basic level, a blockchain is a distributed ledger. Information is recorded in groups called blocks, and those blocks are linked together in chronological order. Once information has been added and confirmed, changing historical records becomes extremely difficult without affecting the rest of the network. The technology became widely known because of Bitcoin, but blockchain itself is broader than cryptocurrency. It can potentially be used for financial transactions, asset tracking, supply-chain records, digital ownership and other applications that require transparent and verifiable data. For investors and traders, understanding blockchain can be useful because it provides the infrastructure behind many digital assets and decentralized financial systems. How Does Blockchain Work? A simplified blockchain process usually follows several steps: 1. A transaction or data record is created A user sends cryptocurrency, transfers a digital asset, or submits another type of information to the network. 2. The network verifies the information Computers participating in the blockchain network check whether the transaction follows the network's rules. 3. Valid transactions are grouped into a block After verification, multiple transactions can be collected into a new block. 4. The block is added to the blockchain The new block is cryptographically connected to previous blocks, creating a historical chain of records. 5. The updated record is shared across the network Multiple participants maintain copies of the blockchain, allowing the ledger to be independently verified. The exact process differs between blockchains. Networks such as Bitcoin and Ethereum use different technical designs and methods for validating transactions. Why Is Blockchain Called Decentralized? Traditional financial and data systems often rely on a central institution to maintain records. For example, a bank maintains its own transaction database. Users generally trust the bank to correctly update balances and process payments. A decentralized blockchain distributes record-keeping across multiple network participants. Instead of relying entirely on one organization, the network uses predefined rules and consensus mechanisms to determine which transactions are valid. Decentralization does not mean that every blockchain operates without organizations or influential participants. The degree of decentralization can vary significantly between networks. However, the distributed structure is one of blockchain's defining characteristics. Blockchain and Cryptocurrency Cryptocurrency and blockchain are closely connected, but they are not the same thing. A cryptocurrency is a digital asset or token that may operate on a blockchain. Blockchain is the underlying technology used to record transactions and maintain the network's history. Bitcoin, for example, uses blockchain technology to maintain a public record of transactions. The Bitcoin blockchain allows participants to verify transaction history without relying on a traditional central database. Other blockchains can support additional functions. Ethereum introduced a widely used model for smart contracts, which are programs that can execute predefined actions on a blockchain. As a result, blockchain ecosystems have expanded beyond simple digital payments. Why Blockchain Matters to Investors and Traders Blockchain technology has created an entirely new category of financial markets. Digital assets can trade continuously across global exchanges, while blockchain data can provide additional information that is not normally available in traditional markets. For example, public blockchain networks may allow market participants to observe: Transaction activity Wallet movements Network usage Token supply changes Smart contract activity This does not necessarily make trading easier or more predictable. Blockchain data requires interpretation, and public transaction information does not automatically reveal the motivations behind market activity. Nevertheless, blockchain has introduced a more transparent form of infrastructure compared with many traditional financial systems. Potential Advantages of Blockchain Blockchain technology can offer several potential benefits: Transparency: Public blockchains can allow participants to independently verify recorded transactions. Security: Cryptography and distributed validation can make unauthorized changes to historical records more difficult. Reduced dependence on intermediaries: Some transactions can be processed directly between network participants. Programmability: Smart contracts can automate certain processes and financial operations. Global accessibility: Blockchain networks can operate across borders and remain available outside traditional banking hours. However, these advantages depend heavily on the specific blockchain, its design, governance, security and level of decentralization. Limitations and Risks Blockchain technology is not automatically more efficient or secure than every traditional system. Some networks face limitations involving transaction speed, fees, scalability and energy consumption. Smart contracts can also contain vulnerabilities, and users may lose access to digital assets through private-key mistakes or security failures. For traders and investors, cryptocurrency markets introduce additional risks, including: High price volatility Liquidity risk Regulatory uncertainty Exchange failures Smart contract vulnerabilities Fraud and scams Understanding blockchain technology should therefore be viewed as part of a broader approach to understanding digital assets rather than as a guarantee of investment success. A Simple Way to Think About Blockchain A blockchain can be compared to a shared digital ledger that is maintained by multiple participants. Each new page of information is added to the historical record, and participants follow common rules to determine whether new information is valid. Because the record is distributed and cryptographically connected, altering previously confirmed information can be significantly more difficult than changing data in a single centralized database. That basic concept is what makes blockchain important: it provides a way for multiple participants to maintain and verify a shared record without necessarily relying on one central authority. Conclusion Blockchain is a distributed record-keeping technology that organizes verified information into connected blocks. Its development has had a major influence on cryptocurrency markets, decentralized applications and digital finance. Although blockchain offers potential advantages in transparency, verification and programmability, its practical value depends on how each network is designed and used. For market participants, understanding the fundamentals of blockchain provides useful context for evaluating cryptocurrencies and other blockchain-based assets. At the same time, technology alone does not determine the value, safety or long-term viability of a digital asset, making independent research and risk management essential.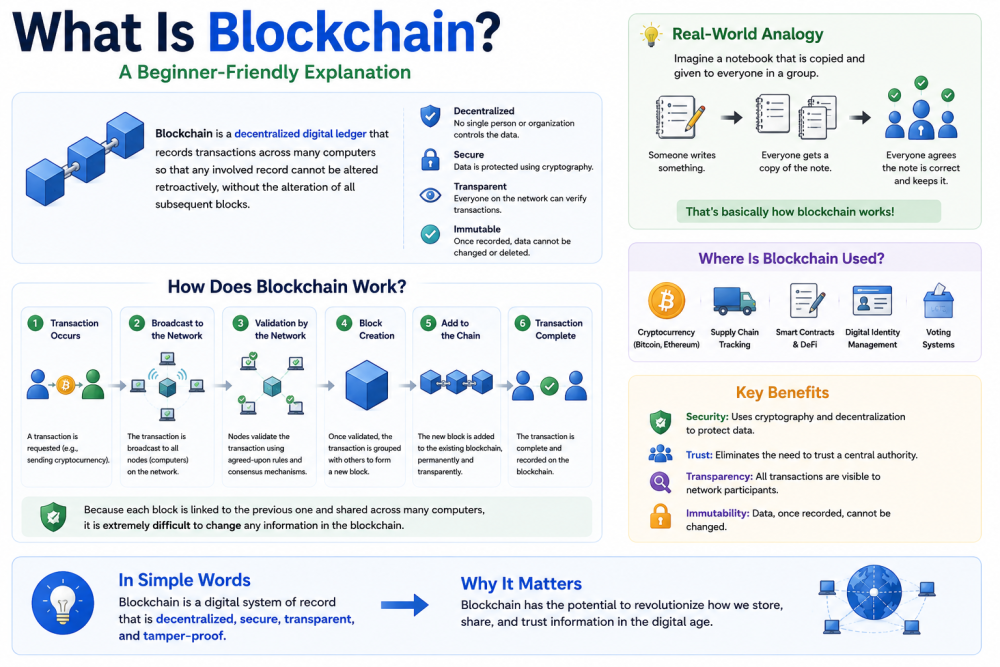
-
 MatteoDumont joined the community
 -
 ranieri93 changed their profile photo
 -
 Mobi wann joined the community
 - Earlier
-
 Sri99 joined the community
 -
 EarningsDesk changed their profile photo
 -
EarningsDesk joined the community
-
 Bxbxotb joined the community
 -
That's the honest question, isn't it. From what I've seen, none of these services publish a verified long-term track record - mostly cherry-picked screenshots and big promises. I'm not expecting a tool to turn headlines into guaranteed trades; I'd just like to see whether the signal quality actually holds up over time compared to reading the news yourself. My plan is to run the free trial, log the signals for a few weeks, and compare them against my own read of the tape. If it holds up, great; if not, no harm done. Thanks for the straight answer.
-
I wish it was just as easy as those services describe it.. scan a headline, generate a trade idea and become a millionaire. Do those service have a proven long term track record?
-
Has anyone tried an AI tool that turns market news into trading signals? I keep seeing these news-analysis services that claim to scan headlines and generate trade ideas automatically. Curious if anyone here has tested one and how the signals actually compared to their own read of the tape. Would be interesting to hear real experiences before considering a subscription.
-
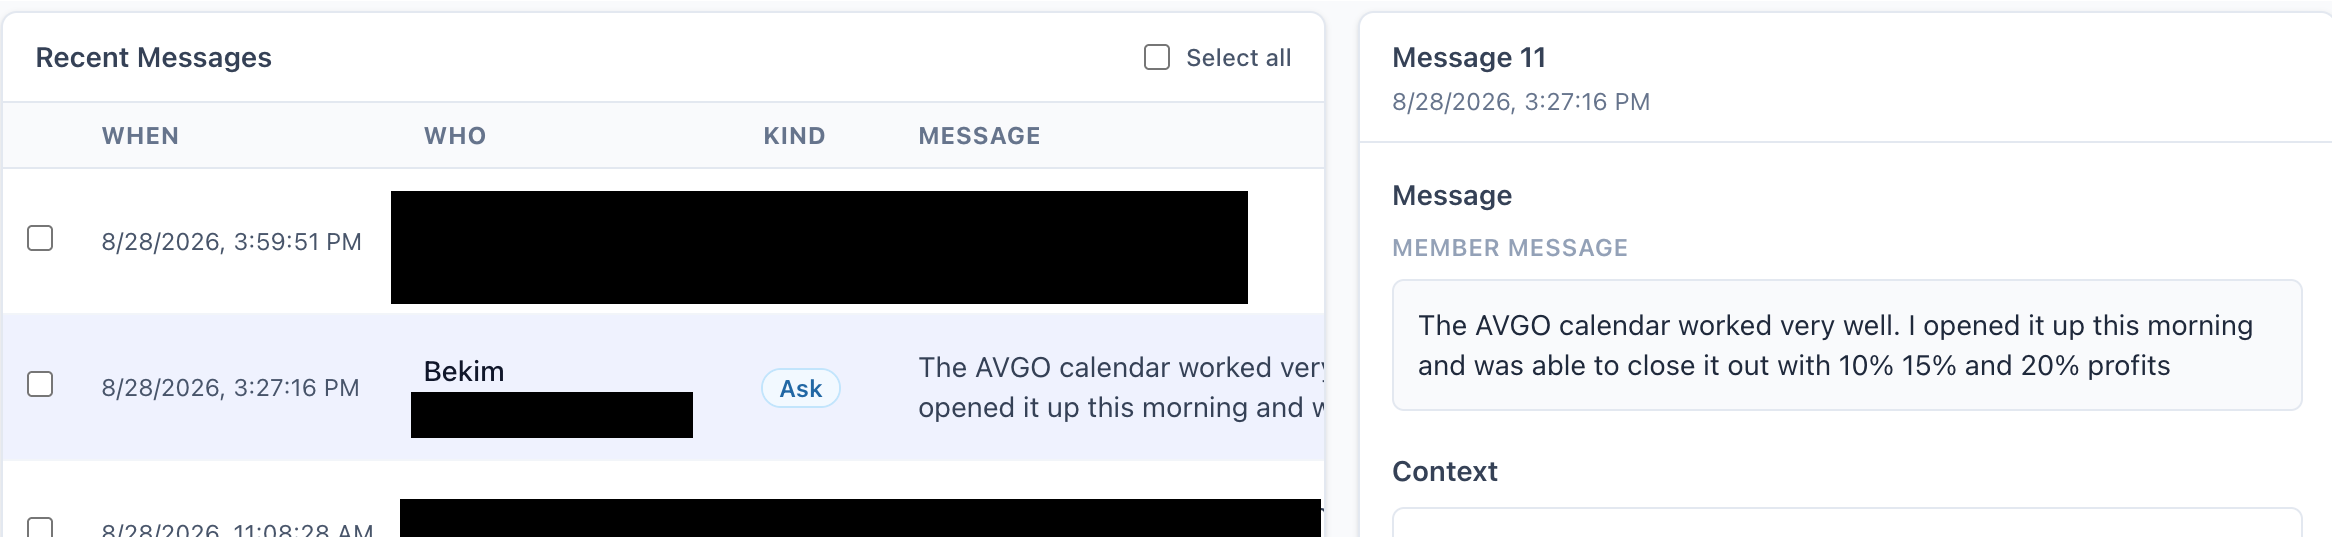
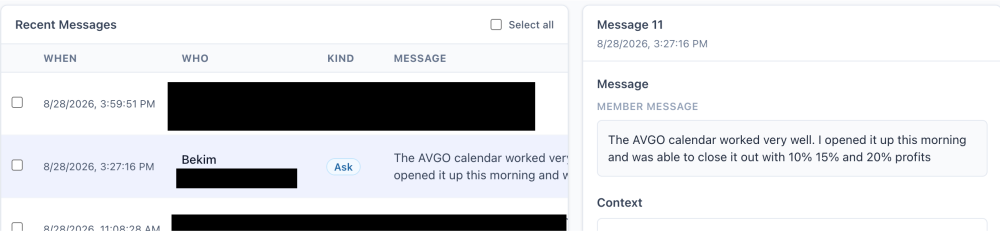
@Bekim's AVGO calendar — shared with his permission A member messaged me before market close today after closing out an AVGO calendar. Sharing it with his blessing (email address redacted): Scaling out in thirds at +10%, +15% and +20% — that's the part I'd highlight, more than the ticker. He didn't swing for the best cell on the board; he set staged exits and let the position pay him on the way through. Exit discipline like that is what makes a good setup a good trade. For anyone who wants to study the same setup after the fact, here's what the calendar matrix showed for AVGO in that entry window: Below is the Entry today row from return matrix. And the standard honesty note, because one message doesn't change the math: a well-executed winner doesn't validate a strategy any more than one loser invalidates it. The losing cycles are still right there in the cell popup, and the next person opening this trade should size for them. What history gives you is a fair price for the bet — the discipline in how you enter, size, and exit is what this member supplied himself. @Bekim found AVGO RV line is historically low this cycle & entered the trade. He is pretty new user to EarningsStudy, he is still learning how to use various options strategies. And EarningsStudy has plenty of back tested strategies. If you've run your own setup through the app — win or lose — We from SteadyOptions team would love to see it because the losses teach the thread as much as the wins do. NOTE: I entered AVGO a little earlier than Bekim did, and a run of bad news knocked the stock from ~420 down to ~360 in the span of three days. It's a good reminder for the calendar strategy: even a 100% win rate in past cycles doesn't guarantee the next one. But with proper positioning and re-centering, the P/L can still be managed — that's the part that comes with experience. SO members on the ALL bundle: full core access to EarningsStudy is free through the partnership — sign in at earningsstudy.com with your SO email. Historical/educational analysis, not financial advice or a trade recommendation. Options trading involves substantial risk.

-
This is a great tool; it takes a lot of the guesswork on finding the sweet spot for an entry and whether to take or avoid a trade
-
As mentioned in the first post of this topic: Follow a forum to get notified about new topics posted on that forum. When a new topic is posted, only the first post will be sent. If you are interested to get the rest of the posts, you will need to follow the topic specifically. Also: A member has the ability to follow another member. You can follow few members that you find helpful, and you will get all content posted by those members. Following all contributors will automatically get you everything they post without the need to follow every topic individually.
-
Good morning, I am subscribed to the alerts through email however, I dont seem to get any alerts when there is an update on the trade (add / close) thus I have to check the website constantly. Is there a way to get another email notification?
-
I'll add documentation about it later today.
-
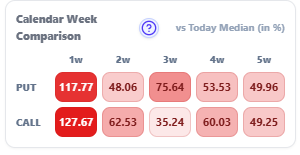
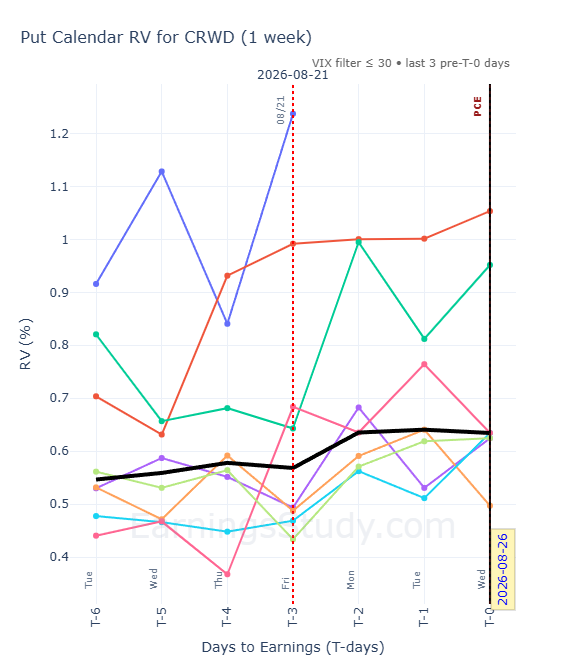
Hi Kim Can you please explain how this calendar week comparison table works and how the selection of the eg put strike distance in the graph is selected. Would according to the calendar week comparison in this case a call calendar 1 w be even better? Great site overall and so much to discover. Thank you.
-
Dashboard redesign is live — the app now starts with your day, not a blank search box The dashboard got a ground-up redesign. The idea behind it: you shouldn't have to go hunting every morning — the first screen should already know what today looks like and what you care about. What's new: Today, at the top. The day's report queue — who's in an entry window right now, before you've typed anything. Next to it, Your week: the full lane of what's coming, so Monday-you can see Thursday's setups forming. "Opportunities for you" — with your definition of an opportunity. Three presets to start: Top winning trades (highest median return on the board, any structure), Most consistent (sorted by win rate, and only names with 2 to 3 years earnings cycles of history behind the number — no small-sample heroes), and Tightest spreads (lowest NBAS first, so tradeable markets rank ahead of wide ones). "Where's your bar?" — the preferences wizard. This is the part I'm most pleased with. Tell the dashboard your standards once and it filters everything to match: minimum win rate, median return range, how much spread cost you'll tolerate, which structures you trade, weekly-options-only if that's your rule, and "only my symbols" if you want your watchlist and favorites and nothing else. Filter by how the trade wins, not just what it's called. Every structure is tagged by its profit mechanism — IV crush (iron flies), needs a move (straddles, strangles, long options), near-strike + IV (calendars), IV + move (double diagonals). If you're only in the mood to sell the ramp, or only want defined-risk movement bets, one filter shows you just those setups. It's a small thing that changes how you scan. Your tracked setups, front and center. Anything you're tracking from a strategy page now has its own panel on the dashboard — the day-by-day repricing you've pinned, waiting for you at login instead of three clicks deep. And it's fast. Everything here came from watching how you all actually start your mornings — and several pieces trace straight back to questions asked on this thread. Keep them coming: if your first five minutes in the app still involve a workaround, that's the next thing I build.
-
 Thinking about taxes proactively allows you to structure your investments and financial decisions to minimize your obligations and maximize long-term returns. This is the difference between reacting to a tax bill and strategically managing your financial future. Understanding Your Taxable Events For most investors, selling an asset for a profit is a taxable event. While this is a major component, it's not the full picture. A taxable event is any action that triggers a tax liability. This can include receiving dividends from stocks, earning interest from bonds, or even exercising certain types of employee stock options. Each of these events can add to your taxable income for the year. Forgetting to account for them can lead to an unpleasant surprise at tax time. A key part of modern tax planning is clearly understanding how your portfolio generates taxable income throughout the year, not just when you decide to sell. The Role of Stock Options in Your Tax Strategy Employee stock options can be a fantastic way to build wealth, but they also add a unique layer of tax complexity. Incentive Stock Options (ISOs) are particularly noteworthy. While they offer certain tax advantages, exercising them can trigger the Alternative Minimum Tax (AMT). This separate tax system ensures high-income individuals pay a minimum amount of tax. Exercising a large number of options might seem like a great move, but it can lead to a surprisingly large AMT bill if you're not careful. Proper planning around when and how many options to exercise is crucial to avoid an unexpected and substantial liability that could otherwise diminish your gains. Strategies for Managing Capital Gains Once you understand your taxable events, you can start using strategies to manage them effectively. One of the most common and powerful techniques is tax-loss harvesting. This involves selling investments at a loss to offset gains from profitable investments. This can reduce your overall capital gains tax and, in some cases, even allow you to deduct losses against your ordinary income. Another fundamental concept is being mindful of holding periods. Investments held for more than a year are typically taxed at the lower long-term capital gains rate. Those held for a year or less are taxed at your higher ordinary income tax rate. Simply being patient and holding a winning investment for a few more months can significantly impact your after-tax return. Leveraging Tax-Advantaged Accounts One of the most straightforward ways to manage your tax liability is to make full use of tax-advantaged retirement accounts like a 401(k) or an Individual Retirement Account (IRA). Contributions to traditional 401(k)s and IRAs are often tax-deductible, lowering your taxable income for the current year. The investments then grow tax-deferred until you withdraw them in retirement. Roth versions of these accounts work differently: you contribute with after-tax dollars, but your qualified withdrawals in retirement are completely tax-free. A combination of these accounts can give you flexibility in managing your tax burden today and in the future. Prioritizing these accounts for long-term growth is a cornerstone of sound financial and tax planning. Proactive Planning vs. Reactive Filing Ultimately, optimizing your portfolio's growth through tax management comes down to a simple mindset shift. Instead of seeing tax filing as an annual chore where you report what already happened, view tax planning as an ongoing strategic process. This means considering the tax implications of every investment decision you make throughout the year. Are you about to sell a stock? Check the holding period. Are you receiving a large cash bonus? Consider how much to put toward a tax-advantaged account. This proactive approach ensures you make decisions that align with your long-term financial goals, turning tax management from a liability into a powerful tool for wealth creation. Effective tax planning is not an afterthought. It's an integral part of a successful investment strategy. Understanding how taxes affect your returns and using the right strategies can significantly improve your ability to build wealth over the long run. This is a contributed post.
 -
He's probably in need of a break from all my questions 😉
-
-
Subscription is currently open.
-
Enjoy your time away will try not to break anything while you are gone
-
Away from Friday 21st Aug afternoon to August 31st Heads-up: I'm away from this Friday 8am ET until Monday August 31st. No scans will be interrupted — the daily pipeline and the scanners run on their own — but I won't be around to answer questions or look at setups during that stretch. Back on the 31st. Romuald - optionbench.com