UserNameNotFound
-
Posts
84 -
Joined
-
Last visited
UserNameNotFound's Achievements
Member (3/5)
22
Reputation
-
I see, that is a subject not very clear to me, as I don't have much experience with options. I see lots of IV(s) everywhere, but usually it is not clear how they are calculated or what they represent. I.e.: intraday x daily IV on ToS. Would ToS daily IV actually be IV30?
-
Hi! @Djtux, Another one for your long list: https://steadyoptions.com/forums/forum/topic/6500-discussion-mrna-august-2020-earnings-hedged-strangle/?do=findComment&comment=146081 If feasible, cloud you include an option to show daily IV on the IV chart along with the IV30 and HV30? Thank you!
-
Thanks for the prompt feedback, @Djtux! Yes, a separate page on RV charts would be fine, or you can just add an advanced options for how many day to plot after earnings. And, Thank you for the advanced options tip, I hadn't realized that was the actual function of that list. Should have played with it.
- 1061 replies
-
- 1
-

-
- rv chart
- volatilityhq.com
- (and 1 more)
-
BTW, I just learned that I can disable a line on the graph by clicking on it! 😁 But, it does not seem to change the average line calculation. So, would it be possible to have that to change according to the lines/cycles shown/selected? Thank you again.
-
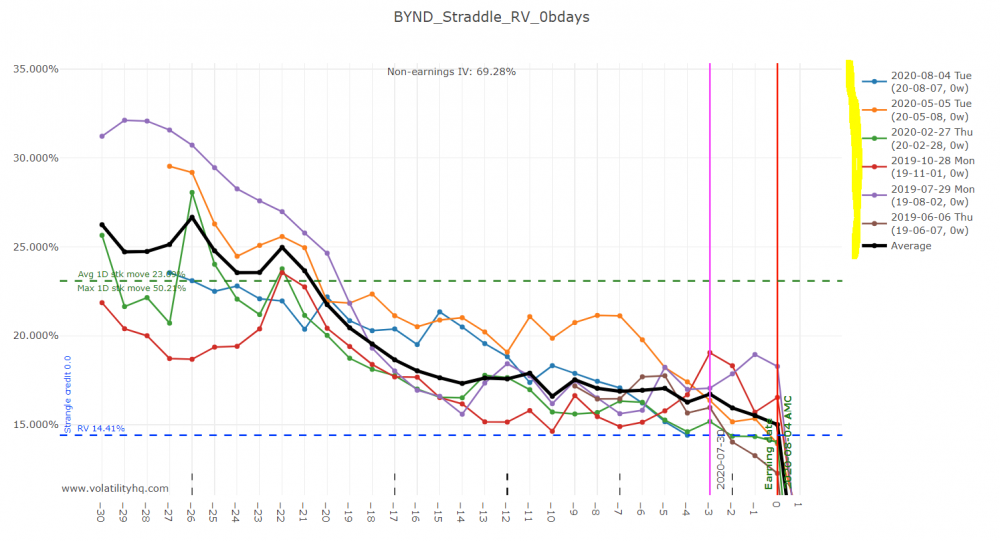
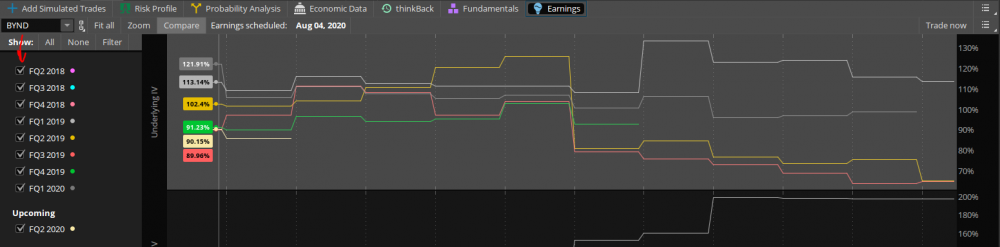
Now, a couple features request: 1. For the RV charts, would it be possible include a check box for each cycle, so we can disable outliers that would influence the average calculation? It would work similarly to what is available on ToS Earnings tab: 2. Could you allow us to select how many days post earnings we want to draw? This would be helpful on other trades strategies that we would hold after earnings and profit on IV crush. This would be applicable for the RV charts and return matrix (exit day). You can limit it to like 10 days or so, as applicable, but at least a week could be useful. Thank you!
-
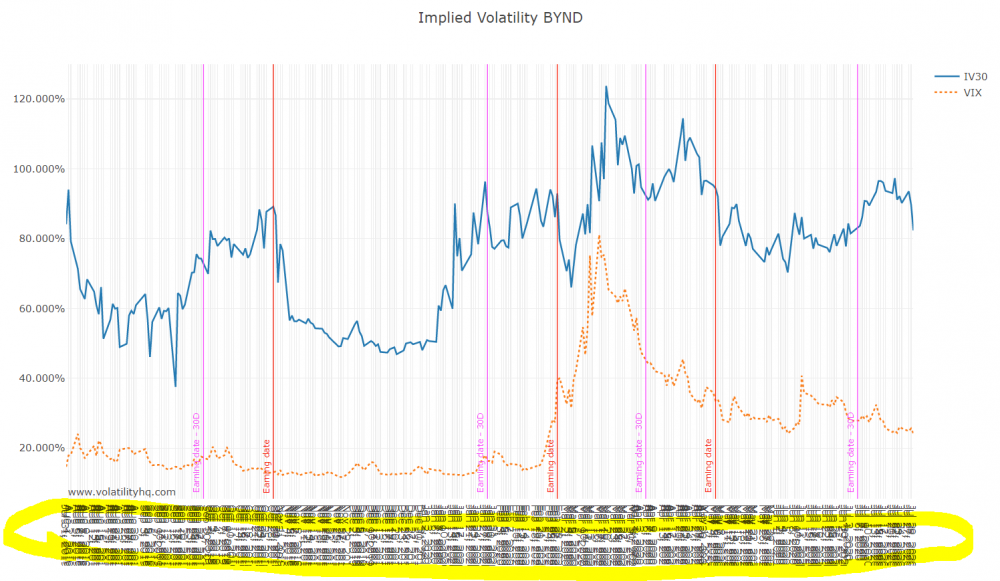
Hi! @Djtux, Brand new user here! First of all, thank you and congratulations for the great tool you developed. Much appreciated. Then, I am very picky with bugs, so I guess I would start reporting the first one I noticed... X-axis labels are overlapping at default settings for the IV chart: