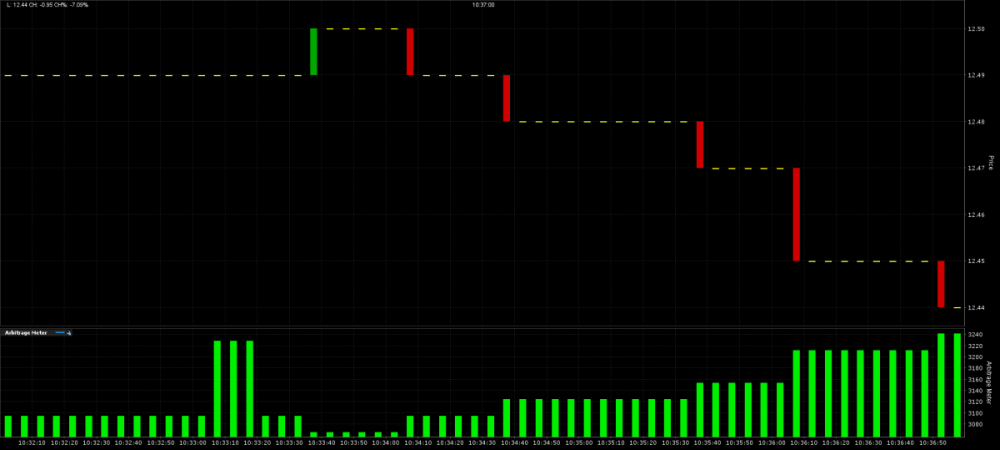
VIX Arbitrage Meter is currently flashing green.
Source: IB
"TWS Arbitrage Meter"
The Index Arbitrage Meter illustrates the extent of the premium (or discount) of the lead month futures price above (or below) its fair future value with respect to the index price. A green bar indicates that the lead month futures price is at a premium to (i.e. greater than) its fair future value. A red bar indicates that the lead month futures price is at a discount to its fair future value. This tool is available for Indices and Futures on Indices.
To see the Arbitrage meter, make sure "Show Arbitrage Meter" is selected under the "Settings" menu.
To display the Arbitrage Meter for an Index
Click on the desired market data line to select the index. Right click and select Show Arbitrage Meter.
https://www.interactivebrokers.com/en/?f=%2Fen%2Fsoftware%2Ftools%2FibTools.php%3Fib_entity%3Dllc
"Performance of VIX Futures"
VIX is more volatile than most assets, and traders can expect VIX futures to be among the most volatile futures contracts as well. To illustrate, from May to November 2004, a period of relatively low volatility, the daily percentage variation of nearby VIX futures ranged from 0.06% to 7.12% and averaged 2.13%. The daily dollar variation ranged from $10 to $1330 and averaged $358.
"Fair Value of VIX Futures"
Futures traders are most familiar with the fair value of stock index futures derived from the cost-of carry relationship between the futures and the underlying stock index. Since there is no carry between VIX and a position in VIX futures, the fair value of VIX futures cannot be derived by a similar relationship.
Instead the fair value is derived by pricing the forward 30-day variance which underlies the settlement price of VIX futures. The fair value of VIX futures is the square root of this expected variance less an adjustment factor which reflects the concavity of the square root function used to extract volatility from variance1. In percentage points, the fair value of VIX futures is:
In this expression, Pt is the forward price of de-annualized variance in the 30 days after the futures expiration, and -vart[FT] is the concavity adjustment. The adjustment subtracts the variance of the futures price at expiration, which can also be expressed as the cumulative daily variance of VIX futures from the current date to expiration.
Using methods similar to those on which the calculation of VIX is based, the forward price of the 30-day variance can be determined from a synthetic calendar spread of S&P 500 options bracketing the 30 days after the futures expiration. The variance of the futures price can be estimated from historical data on the daily variance of VIX futures.
Example:
Suppose that we want to estimate the fair value of May 2004 VIX futures on March 19, 2004. When this contract expired on May 19, 2004, its final settlement price reflected implied volatility for the 30-day period from May 19 to June 19, 2004. The fair value of the futures is the square root of the forward price of squared volatility (variance) over this period adjusted downward by vart[F5/19], the variance of the May 2004 VIX futures price from March 19 to May 19, 2004. Since VIX futures did not start trading until March 26, 2004, we looked at contract history from March 26 to May 19 to determine that a plausible value for vart[F5/19] would have been .0013. Going forward, an estimate of the variance of the futures price entails modeling the process for VIX, and estimating the parameters of the model from historical values of VIX and VIX futures prices.
"Determination of Pt"
Since variance is additive, the forward price of de-annualized variance between May 19 and June 19, 2004 is equal to the forward price of de-annualized variance between March 19 and June 19 less the forward price of de-annualized variance between March 19 and May 19. We write this as Pt = Pfar - Pnear.
Pfar is determined from a portfolio of out-of-the-money S&P 500 options expiring on June 19, 2004: Pfar = ert2 PJune options, where r is the money-market rate and t2 is the time from March 19 to June 19, expressed as a fraction of the year. The price of the option portfolio is multiplied by the interest rate term ert2 to convert it to a forward price.
Pnear is extrapolated from May and June options because May 2004 S&P 500 options expire on May 22, not May 19. Pnear = [30/28 ert1 PMay options - 2/28 ert2 PJune options], where
PMay options is the price of the portfolio of 2004 May options which replicates the de-annualized variance between March 19 and May 22 and t1 is the time from March 19 to May 22.
This leads to
Pt = Pfar - Pnear = 30/28(ert2 PJune options - ert1PMay options)
The valuation of the replicating portfolios of May and June options is the same as the method used to calculate VIX. The table below shows the calculation for May.
Click here for larger version
ert1 PJune options = .0106 ert2 PMay options = .0068
The de-annualized variance priced by the synthetic calendar spread from May 19 to June 19 is equal to: Pt = (30/28) (.0106 - .0068) = .0041
Determination of Fair Value
The fair value of May 2004 VIX futures is equal to:
This estimates the market's March 19 forecast of volatility from May 19 to June 19 implicit in the prices of S&P 500 options.
To quote the fair value in the same terms as VIX futures, multiply by 10:
March 19 Quoted Fair Value of May 2004 VIX Futures = 183.60
"Stacking and Rolling VIX Futures Positions"
Because VIX futures of successive maturities track implied volatilities for successive 30-day periods, e.g. May 2004 futures track implied volatility from May 22 to June 21 and June 2004 futures track implied volatility from June 19 to July 19, they can be stacked to cover implied volatilities for longer periods of time. For example, a stack of May and June 2004 VIX futures approximately tracks a 60-day implied volatility (with a two-day overlap).
Investors can choose between stacking successive futures at the outset or rolling from one futures contract to the next as the nearby contract expires. This is analogous to choosing between stacking and rolling Eurodollar futures, or choosing between a fixed rate and a variable rate mortgage. Investors who hold the nearby futures position up until the date of expiration rather than rolling it shortly before expiration must remember that the Final Settlement Price will not match the VBI. Also note that the effect of rolling from one contract month to the next is not to extend your leverage from the first to the second expiration date, as it would if these were stock index futures. This means that the spread between the first and second futures prices should not be viewed as a cost of interest or "roll cost".
"From VIX Futures to The Term Structure of Implied Volatility"
The term structure of implied volatility is the curve of implied volatilities for periods extending from the current date to different future dates, e.g. March 19 to April 12, March 19 to April 13, and so on. Points of the curve at different terms can be estimated from option prices with matching expirations. One method is to find the Black-Scholes implied volatilities of at-the-money options. Alternatively, the implied volatilities can be calculated from the prices of strips of out-of-the-money options which replicate the variances, the "VIX Calculation". The chart below shows term structures derived by both methods on March 19, 2004. The complete term structure can be inferred from listed option expiration points by different methods of extrapolation.
Similar to the term structure of interest rates, the term structure of implied volatility is generated by spot and forward volatilities, more precisely by spot and forward variances since it is the variances which add up, not their square roots. In light of this, VIX and VIX futures prices can be squared and pieced together to yield alternative estimates of various points of the term structure of implied volatility. Some inter- or extrapolation is required because VIX and VIX futures usually don't cover contiguous periods. For example, had April 2004 VIX futures been listed on March 19, 2004, they could have been pieced with VIX to yield an alternative estimate of volatility to May 22, 2004 than the estimate given by May 2004 SPX options.
* The methodology of the CBOE Volatility Index is owned by CBOE and may be covered by one or more patents or pending patent applications.
http://cfe.cboe.com/education/vixprimer/features.aspx