YVRFlyGuy
-
Posts
38 -
Joined
-
Last visited
YVRFlyGuy's Achievements
Jr.Member (2/5)
31
Reputation
-
That would be a fantastic enhancement that would probably improve functionality for everyone. For example I want to always use a start date of 2018-01-01, to show stock price changes and use a T-x of 40, so these parameters I have to reset every time I go from the scanner to another page. A minor irritation, but if I could set those as defaults it would be a big help.
-
Not everyone is using the data being presented in the same ways. Every time you make an entry the webpage creates a dataset that is then used to generate the charts you see. Some users will be more interested in the data itself rather than how the specific charts are presented. The dataset that is generated is changed by each of the selections relating to the advanced options available. If the user wants the data to be generated from a fixed date forward or for a fixed T-x period that can be selected once in the advanced options and will then be fixed for any future queries during a session. But if the system were to automatically exclude certain cycles then for every query that would require the user to go in manually and scroll through the list of cycles to find the excluded cycles and then reselect them. I agree that that is the problem whether the question is if you want to see the cycles or you don't, I just don't think that the default should be that some variable portion of the data should be excluded unless the user intervenes to get it included.
-
That idea would cause some significant problems for how I use the data, so my request would be to please not do it. Automatically excluding cycles within certain time frames would screw up a lot of calculations I make that rely on all of the presented data being available. If you start automatically cutting out a cycle or cycles from every underlying then different parts of the data will be removed for different underlyings making them much harder to compare to each other. I understand that it is a question of either way somebody has to go and manually select or deselect elements of the dataset they want to see or hide, but the default should remain that all the available data is presented unless the user selects otherwise.
- 1061 replies
-
- 1
-

-
- rv chart
- volatilityhq.com
- (and 1 more)
-
Thanks!
-
@Djtux With the scanner function is it possible to add columns that would show what strikes were used to compute the straddle and calendar prices?
-
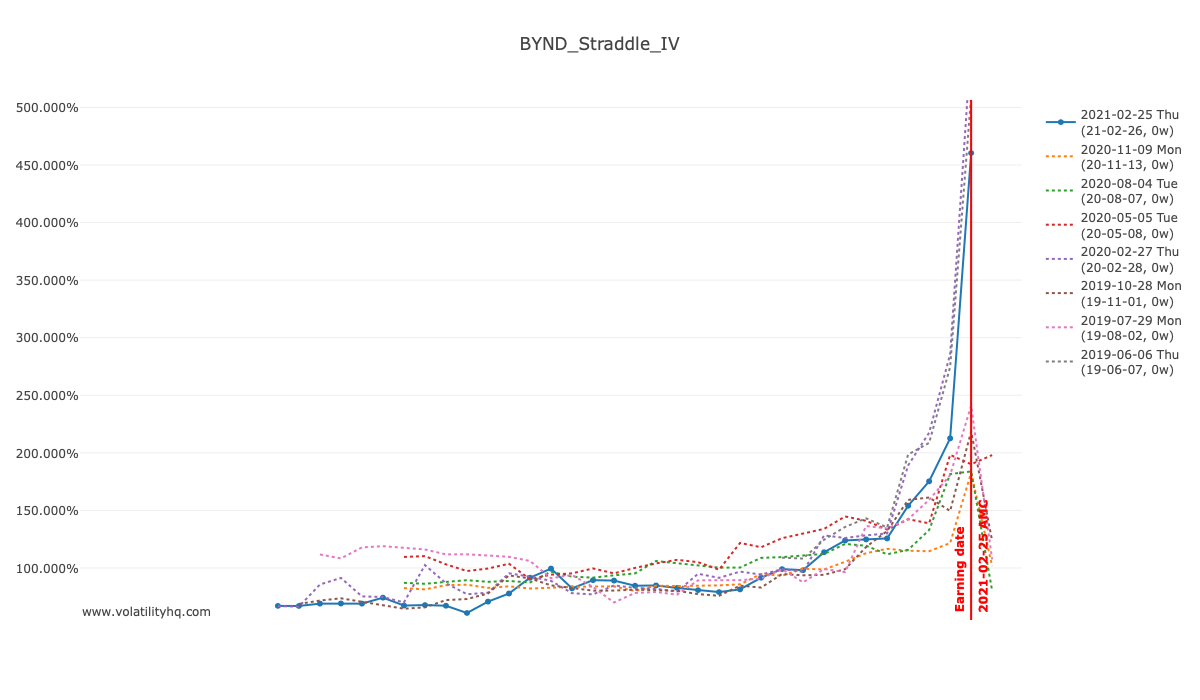
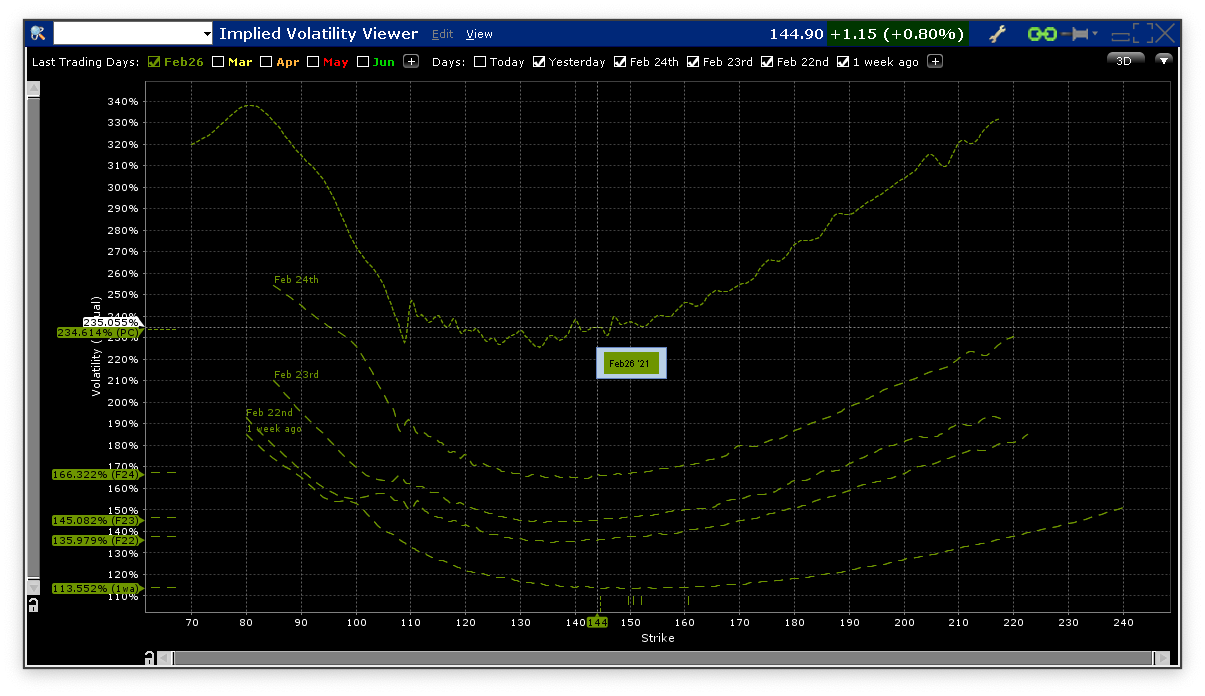
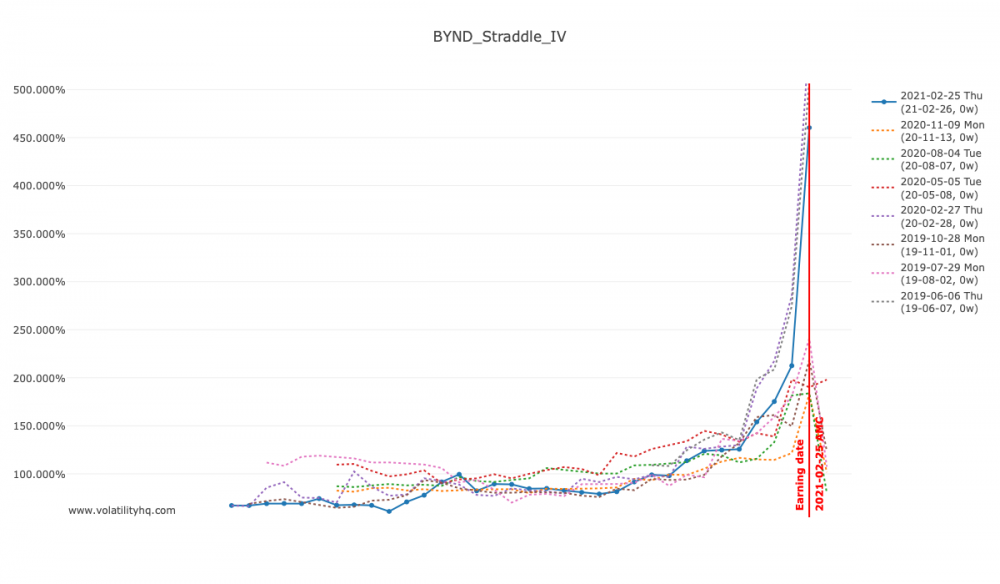
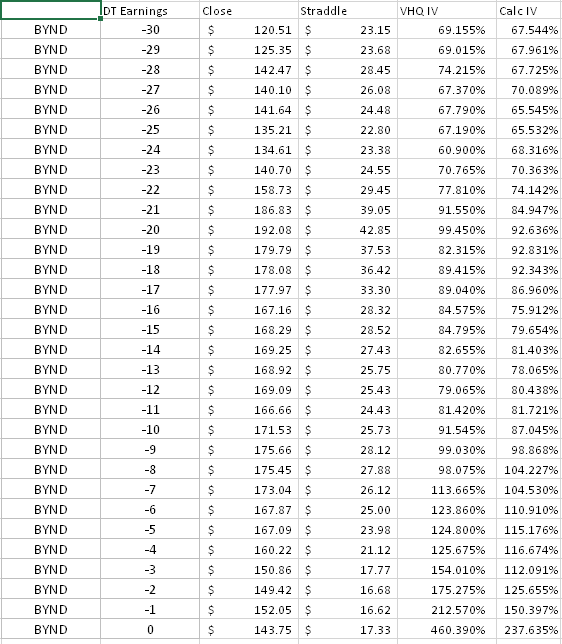
@Djtux I'm wondering if you can help me understand a difference I'm observing between the straddle IV's shown on your charts and the IV's I'm seeing with IB and what I get when calculating the IV backwards from the straddle prices you are showing for each day? Here is the IV chart for BYND which reported earning yesterday. It shows a T-0 IV of 460% for the $144 straddle expiring on Feb 26. The straddle price is shown elsewhere as $17.33 with spot at $143.75. Using those parameters my calculation of the ATM straddle IV comes out to about 238%. Using IB's Implied Volatility Viewer I get a similar value of 235% for the Feb 25 close and that's consistent with what I observed while trading BYND near the close. So I'm wondering how the 460% IV in the chart was arrived at. I did up a little spreadsheet for BYND to compare the IVs in the chart versus my calculated ones and it looks like there's a similar difference throughout. The formula I'm using for the comparison is IV = (Straddle Price (Extrinsic part) *20) / (Stock Price * Sqrt (T)) where T is time expressed as the number of trading days left until expiry. Thanks for any info.

-
-
Oops, sorry about that. My initial thought was by dividing things up by quarters, Jan-Mar, Apr-Jun, Jul-Sep & Oct-Dec. The majority of companies report after AA and AA usually reports 2-3 weeks after the start of each of those quarters. There would probably be a few companies that would flip/flop back and forth over those quarter ends, but probably not very many, and if you were to assign cycle numbers by doing a backwards count with the present quarter (Jul 1 - Sep 30) as cycle 0 and then assigning each previous report to cycles 1, 2, 3, ... etc they would probably group fairly well. There might be a few instances of forced early reports due to material changes that would end up being outside of the defined quarter parameters but I doubt it would be many or that they would have much effect on the broader picture. From some other trades I've done in the past I found that each season can have its own flavour and that a trade that was wildly successful in the previous season can turn stone cold the next. This may be what is being observed with the number of instances of straddle RVs that historically have maintained value over the last few days to earnings but which seem not to be following that pattern this time. Being able to observe that effect as it becomes quantifiable over a growing number of reports as each quarter develops could help inform decisions about how to allocate to RV related strategies that appear to be running hotter or colder than normal. Should be a piece of cake, right 🙃!
-
Hi Dustin, As discussed by Yowster in this thread: https://steadyoptions.com/forums/forum/topic/6514-uber-pre-earnings-straddle-idea/ there is a question about whether market dynamics during this earnings cycle are departing from the dynamics generally observed in past cycles. I was wondering if your data could be configured to cast some light on the question. Would it be possible make a display of the straddle RV charts and tables done in aggregate for each earnings cycle? So, instead of displaying the results of one stock across 8 cycles we might see the results (and mean/median) of all optionable stocks over a given cycle? Ideally, could this be filterable so that one could select the price range, IV range, HV range, VIX range, industry, sector & availability of weekly options for a subset of the data? And ... could it be possible to then do a meta study of past cycles and the current cycle in comparison with each other? Again ideally with the same dataset filter capabilities? I know it's a bit of an ask, but looking at the information in ways like this could provide some insight on the degree to which a current cycle is matching previous patterns, and which groups of stocks are experiencing changes, and how that might suggest which strategies are likely to work best in the current environment. Thanks for anything you can produce, and my appreciation for having built such a valuable analytical tool. It's well worth the fee you charge for it.