

Ophir Gottlieb
-
Posts
272 -
Joined
-
Last visited
-
Days Won
3
Content Type
Profiles
SteadyOptions Trading Blog
Forums
Everything posted by Ophir Gottlieb
-
@Kim I see everyone else in the market guessing if $AMZN or $GOOGL (or whichever stock) will move more or less than the options imply. I see Steady Options members winning without earnings risk -- and that's because of Kim. We're here to help now. Check out these results for $AMZN and $GOOGL over three-years worth of earnings periods -- we did the same thing but we added a 10% stop loss just in case things went bad. AMZN GOOGL We are releasing this feature tomorrow. Come join us for this and everything else we can do together with the backtester Learn More at the CMLviz Option Back-tester
-
Very excited. @Kim Look what we have in beta: And the results for Apple Those results are beta - not tested.
-
Generally, i agree. I do not like earnings trading other than pure speculation. I do like the pre-earnings trades you do -- that has edge.
-
Yep. With earnings trading that holds throughout the period (not exiting before), I never look more than 4 quarters -- this is another example where I feel that more data is worse.
-
For those interested in Apple earnings, three of the last four results have been worth buying an iron condor (butterfly). http://tm.cmlviz.com/index.php?share_key=gEVZqHqUqFvL6uKj I don't like trading earnings, but for those that do, you can check it out above.
-
How Trading Options in Starbucks Corporation (NASDAQ:SBUX) Has Outperformed Date Published: 2017-04-26 Written by Ophir Gottlieb LEDE There is edge in Starbucks Corporation options, and it has led to nearly 200% returns over the last 3-years while the stock was up just 80%. PREFACE WHAT IS EDGE? One of the great beauties of option trading is that the market prices the 'greeks,' which serve as a measure of probability. If a trade wins more often than the probability that is priced in, it has edge. Here is that same thought process, but in English: A 30 delta (out of the money) put should end up in-the-money about 30% of the time (delta is roughly a measure of probability). In other words, if we sold a 30 delta put, we would expect that we could have a winner 70% of the time. EDGE Now, back to our idea of edge. If we can find an option strategy that has a 30 delta, but if selling it wins more than 70% of the time, then we have edge. Even further, even if it wins 'just' 70% of the time, if the net profit is positive, then that's another measure of edge. When we have both, we have a great trading result, and that is exactly what we find with Starbucks Corporation. Starbucks Corporation (NASDAQ:SBUX) If we test selling a 30 delta / 5 delta put spread, every 30-days, and always avoiding earnings in Starbucks over the last 3-years, this is what we find: That's a 198% return, versus a stock return of 80%. Even further, and back to our discussion of edge, the strategy had 34 winning trades and 6 losing trades for a win-rate of 85% -- far above a 70% win-rate we might expect. For context here is how the short put spread (in red) has done relative to the stock (in gray). But this isn't the end of the analysis -- there is one more step we need to make. While the CMLviz Trade Machine (back-tester) allows us to identify edge quickly, it does more than that. Selling a put spread is bullish strategy in that it becomes a winning trade if the stock rises, or, if the stock "doesn't go down a lot." It's fair to wonder if simply buying a call spread would have been better than selling a put spread. Here is how that approach has done over the last 3-years, done every 30-days. Even though Starbucks stock has been up 8% in this time period, and even though selling a put spread returned nearly 200%, it turns out that buying the call spread was in fact a losing strategy. WRAPPING IT UP We can do these same tests over two-years as well. First, here is the return of that same short put spread over two-years and always avoiding earnings: That's a 69.2% return, while the stock was up just 23%. And, even further, we see 21 winning trades versus 5 losing trades, for a 80.8% win-rate. Here is the strategy (in red) versus the stock (in gray): Options are volatile over the short-run, but as time progressed, the short put spread vastly outperformed the stock. And, for the curious, here is how the long call spread did during this time: A 67.7% losing strategy, even though the stock was up. It's not a magic bullet -- it's just easy access to objective data. For completeness, here are the results of the short put spread over the last year: That's a 20.1% return, with a 76.9% win-rate. The stock returned 7.3% in the last year. WHAT JUST HAPPENED We don't mean to make you feel uncomfortable, but this is it -- this is how people profit from the option market -- it's preparation, not luck. Tap Here to See the Tools at Work Thanks for reading. Risk Disclosure You should read the Characteristics and Risks of Standardized Options. Past performance is not an indication of future results. Trading futures and options involves the risk of loss. Please consider carefully whether futures or options are appropriate to your financial situation. Only risk capital should be used when trading futures or options. Investors could lose more than their initial investment. Past results are not necessarily indicative of future results. The risk of loss in trading can be substantial, carefully consider the inherent risks of such an investment in light of your financial condition. The author is long shares of Starbucks Corporation (NASDAQ:SBUX) as of this writing. Back-test link.
-
The risk that is used for the PnL of the back-test is done exactly how Kim does it -- as everyone should do it. The limit/stop section is the spot where we give users more flexibility.
-
Yeah, I mean this is obviously really odd, but still, it's noteworthy. I would also caution against weird timing of rolls (like 50 days) and try to stick with 7, 14, 30, 60, etc.
-
Actually.. I'm looking... OK, here's what happened: Original test Return 11,952 Risked 5,836 New test Return 9,447 Risked 8,255 So, the one that swapped into the options that expire one week later from the original saw more losses pile up, which of course increases the amount that was risked over the two-years. That ~$2,600 increase in losses made the return much lower as the denominator rose. Pretty weird situation, really, but, it happens.
-
How to Trade Volatility in Apple Inc Options Date Published: 2017-04-24 Written by Ophir Gottlieb LEDE Owning Apple Inc options, without taking a position on stock direction, has been a winner over the last three-, two-, and one-year, but only with a deft hand and a proper understanding of the stock volatility. PREFACE Apple Inc (NASDAQ:AAPL) has unique stock volatility, and from those dynamics (or, in English, "patterns"), we can show how an option strategy that owns option premium has been a winner. Here is the two-year stock chart: What we see, above all else, irrespective of stock direction, is that the price tends to move with momentum. Said a little bit more like English, the stock doesn't have many "quiet periods," rather when it rises, it tends to keep rising or when it falls, it tends to keep falling. This means there are three critical steps to trading options in Apple Inc we need to address. STEP I: EARNINGS HANDLING Let's start with a comparison of owning an at the money iron condor and trading it every 30 days. The left side is this strategy done only during earnings, and the right side is done at all times (including earnings): Owning option premium during earnings has been a net loser, returning -9.4% over the last two-years. But, owning option premium during all-times has been a net winner, with a 11.9% return. It's clear that step one of our strategy is to avoid earnings. Here are the results of owning that same iron condor, but this time, always avoiding earnings. As expected given our first test, avoiding earnings takes the option premium owning strategy up to a 33.8% return over the last two-years. Now, on to step two: STEP II: STOP LOSS It turns out that closing a losing iron condor when it hits a certain level has actually helped returns. That is, a risk mitigation strategy does both: reduce risk and improve returns. Here is the simple setting in our test: We note that the setting "At Normal Trading" is short hand for this implementation: If the stop loss is hit, close the position, and wait the rest of the month before entering a new iron condor. And here are the return differences: By adding a risk protection that effectively cuts the risk in half, from a possible 100% loss in any month down to 50%, the actual return rose from 33.8% to 39.7%. This is step two, and now we will make use of that stock chart from the top of the article, and implement step 3. STEP III: STOP LOSS AND STOCK DYNAMICS We noted that Apple Inc stock does tend to move with momentum. That phenomenon gives us reason to believe that if a stop loss is triggered, which would happen if Apple stock is in a rather low volatility stretch, we might expect that this "quiet period" will end quickly and getting back into owning options sooner rather than later, could be a good idea. Here is the simple setting in our test: Notice that this time the "Immediately" setting has been chosen rather than "At Normal Time." This setting is short hand for: "If a stop loss is triggered, close the original position out, and immediately (the same day) open a new iron condor using the next month's options." And here are those return differences: All of a sudden the return nearly doubles, from 39.7% to 64.8%, and this time the only difference in our strategy was the timing of the re-entry into the option position after a stop loss was triggered. We did a lot here, so let's just take a step back and see it all in one summary: Our three-step process revealed a 64.8% winner, up from a 9.4% loser, and reduced risk twice buy eliminating earnings and using a stop loss. Apple stock is up 12% over this two-year period, so the option strategy returned about five-fold the stock. Even better, it took less time to figure this out with the right tools than it did to read this article. Tap a few buttons -- that's pretty much it. CONSISTENCY This approach also worked well over an one-year time period. That's a 110% return by owning the iron condor and (i) avoiding earnings, (ii) using a stop loss, and (iii) re-entering a new position immediately following a stop. Apple stock is up 38% over this one-year period. WHAT JUST HAPPENED This is how people profit from the option market - it's preparation, not luck. Even further, the CMLviz option back-tester is the conduit to finding these results. To see how to do this for any stock, index or ETF and for any strategy, with just the click of a few buttons, we welcome you to watch this 4-minute demonstration video: Tap Here to See the Tools at Work Thanks for reading. Risk Disclosure You should read the Characteristics and Risks of Standardized Options. Past performance is not an indication of future results. Trading futures and options involves the risk of loss. Please consider carefully whether futures or options are appropriate to your financial situation. Only risk capital should be used when trading futures or options. Investors could lose more than their initial investment. Past results are not necessarily indicative of future results. The risk of loss in trading can be substantial, carefully consider the inherent risks of such an investment in light of your financial condition. The author is long shares of Apple Inc (NASDAQ:AAPL) as of this writing. Back-test link.
-
Yep. All will be 100% customizable soon. Already very flexible. Price will likely rise once we add the custom strategies,which includes custom dates around earnings and then stock technicals as well.
-
Yeah, the custom strategy is by far our most desired new feature. We will have it out by May 15th (ish). I am pretty excited about too, tbh. Once we release that (and two more years of history and some other stuff), the price will likely increase for members that join after (but not for current members).
-
We use Option Metrics for our option data. They are the institutional vendor of choice.
-
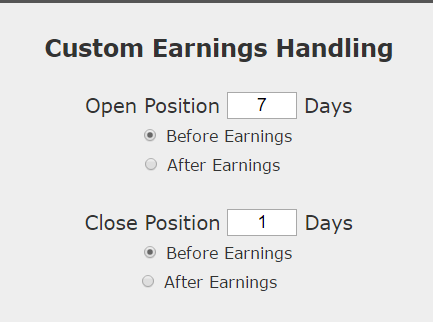
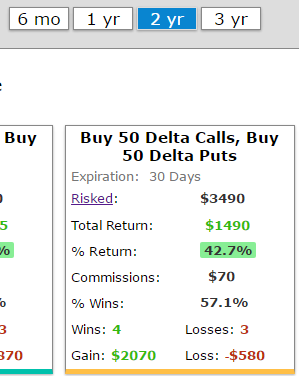
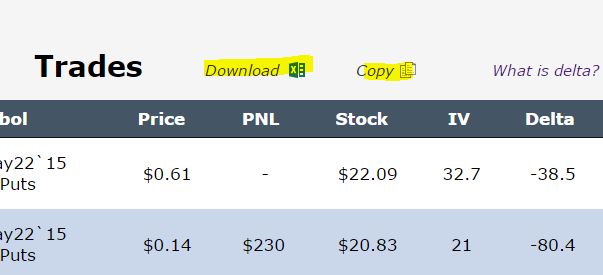
PREFACEYou spoke, we listened. We have released upgrades to the Trade Machine, and they are substantial. We have also listed the next upgrades that are coming at the end. I .Big News (this is an enormous upgraded feature) Custom timing of re-entry into positions after a stop loss. This is so big, we made a movie demo for it: Stop Losses - With a Brain II. Big News Excel Downloads are available in the trade details Copying to the clipboard is also available in the trade details Here is a snapshot: III. Commission Centric We have added the total commissions paid per back-test into the summary tile. Here is a snapshot: IV. Improved responsiveness and speed V. Trade details now page up and down and Stock Price is now in the details Here is a snapshot What's Coming NextIn the next month we will be making an even larger upgrade: 1. Intra-day prices for stop losses and limits We will use intraday prices to see if stops and limits are triggered 2. Custom strategies Create and save your own custom strategies (up to 4 legs) This enables calendars, butterflies, ratios, and more 3. Dollar denominated spreads If you don't like deltas, use dollar spreads (e.g.: test a $5 wide call spread in Apple) 4. More history We will be adding a fourth and fifth year of history to the back-tester
-
So, you are asking some very good questions, rarely does someone go this deep. This is what I do: (1) I check everything, by default, as half way to mid and market -- I do consider this slightly conservative based on the names I trade. (2) Then I check the exact same strategy, just flip my settings, and got to mid-market (I love that it's this easy to check, and it's one of the advantages of being the creator --I get to build the features I use to trade ) (3) If the difference is large, I look at the trades and see if there is liquidity -- I literally look at my option screen / broker / analysis tools and see if the fills are near the NBBO or better. If I truly feel that in the size I want to trade,that mid market is more realistic, I switch to that setting and move forward. If the difference is small, I just go with the more conservative setting.
-
The Surprising Reality of Option Trading in Morgan Stanley (NYSE:MS) Date Published: 2017-04-19 Written by Ophir Gottlieb LEDE In a bull market, selling puts or put spreads is generally a good bet -- but with Morgan Stanley (NYSE:MS), it turns that owning options, rather than selling them, has been monster winner over 3-years, 2-years, 1-year and even the last 6-months. PREFACE Morgan Stanley stock has actually been more volatile than you might have expected. For a company that isn't really a takeover candidate, doesn't really face a black swan downside risk and is generally considered a leader in its industry, the stock has not been settled. Here is the three-year stock chart via Yahoo! Finance: Getting long Morgan Stanley options can take many forms, but perhaps the simplest is a long, out-of-the-money strangle. STRANGLES Buying a strangle means buying both a call and a put. Here is how that strategy has done over the last 3-years, trading every month, and always avoiding earnings. We see a 446% return while the stock was up 40%. But, owning options is also a risky investment in that it is an investment that "something" will happen to the stock. Here is how that option strategy (in red) has done relative to the stock (in gray) over those 3-years. A chart is wonderful in that it really gets at the point -- while this strategy was a gigantic winner, it was filled with risk. We can see it bobbing up and down through time. But, as risky as this has been, it has, surprisingly, worked over all time periods. Here are the results over the last 2-years, again, trading monthly and always avoiding earnings. That's a 173% return when the stock rose just 16%. Again, here is the option strategy (in red) compared to the stock (in gray). Yet again, we can see the risk inherent in the options -- but when it comes down to it, it has been a big winner, returning nearly 10-fold the stock. Next we look at the last year: That's a 59.6% return while the stock has risen 59%. For the shorter time frame, the stock and options actually performed very similarly. WHAT JUST HAPPENED In a time when option portfolios may be leaning short puts and put spreads, it's nice to find an alternative to diversify that overarching short volatility bet in a name that has consistently shown more realized volatility than the options were pricing in. What an interesting result and an interesting hedge to a short vol option portfolio. This is how people profit from the option market - it's preparation, not luck. To see how to do this for any stock, index or ETF and for any strategy, with just the click of a few buttons, we welcome you to watch this 4-minute demonstration video: Tap Here to See the Tools at Work Thanks for reading. Risk Disclosure You should read the Characteristics and Risks of Standardized Options. Past performance is not an indication of future results. Trading futures and options involves the risk of loss. Please consider carefully whether futures or options are appropriate to your financial situation. Only risk capital should be used when trading futures or options. Investors could lose more than their initial investment. Past results are not necessarily indicative of future results. The risk of loss in trading can be substantial, carefully consider the inherent risks of such an investment in light of your financial condition. The author has no position in Alibaba Group Holding Ltd (NYSE:BABA) as of this writing. Back-test link.
-
Yeah, we are actually giving two solutions: 1. Download into Excel ('nuff said) 2. Copy to clipboard This is actually my preferred way. It is (i) faster than downloading a file and (ii) works in Google sheets faster. But in any case -- both will be available in a matter of hours. Here is a snapshot of beta:
-
Hi Yowster, I think everything you are saying is valid -- and very shrewd, it's just not what our members want right now. We do polls every month and develop quite quickly. For example, today Excel downloads, Copy downloads, immediate versus wait timing on stops and 5 years of history will be added to the platform. In a matter of days later, we will provide dollar width spreads (not just delta). In a few weeks after that we will have custom strategies (build any custom strategy up to 4 legs) and build any custom timing around earnings (beyond our current functionality of two-days before and two-days after). Once that is done, we will ask again, and get another development list to be completed in days, weeks and a month. If an equal weighted back-test is in the top three, that's what will come next -- if vol charting, vol scanning, technicals, etc are more desired, then we will build that. We are community driven and so far that has helped us build extremely quickly with great purpose. I hope this clarifies our production progress and feature list and i do appreciate yuor feedback -- it's very valuable and helpful. My very best, Ophir
-
We are adding functionality so you can specify spread widths by dollars (rather than deltas). So, you can back-test a $5 wide call spread that is always $3 out of the money (or whatever you decide). That way the risk per trade remains similar. You can expect that by next week.
-
OK, will add. Thanks!
-
This is a copy and paste of what I wrote above, but with boding emphasis added: If you sell a 5 wide spread, and collect $1, the amount risked is $4. If it expires worthless, you made $1 on a $4 risk, you make 25% (assuming margin requirements aren't less than the $5 spread). If it expires at max loss ($4), then you lost 100%. -- So, again, if your max risk is $4 and you lose $4, then your loss is 100%.
-
Thanks, Kim -- great feedback. We actually have avg win, avg loss, #wins, #losses, etc, if you click on a tile --that's how you get the details: All there!
-
#1. This is exactly what we do. If you sell a 5 wide spread, and collect $1, the amount risked is $4. If it expires worthless, you made $1 on a $4 risk, you make 25% (assuming margin requirements aren't less than the $5 spread). If it expires at max loss ($4), then you lost 100%. The only thing that is confusing ppl is the stop losses. #2. When calculating a stop loss, we do look at differently This time let's do a short put @$1 for a $100 stock on the 100 strike (so, at-the-money) Reg T says this requires at least 20% of the stock value ($20) minus the credit ($1), so this has a margin requirement of $19. OK, then you go to the stop loss and think: "alright, I sold this put @ $1, if it goes to $2, I'm out of this trade." To us, that reads as: "alright, I sold this put @ $1, if I lose 100% on my credit, I'm out of this trade." So, we have the stops (and limits) set as a percent of credit or debit. Hopefully that clears it all up -- the real takeaway is that we do use the margin amount as the max risk for the back-test calculations (what I presented above as #1)
-
We will be allowing for dollar denominated spreads by strike, rather than deltas, and that should make it much clearer to people that prefer to think of spreads in dollar widths to see what is going on, and which spreads to back-test. That fix is coming within a couple of weeks.
-
That's right. Amount lost is based on the credit, amount risked is based on Reg T. Since we use closing prices (for now), the stop was triggered once the 50% loss was hit, and the closing price was worse than the 50% loss -- thus the print. Measuring amount lost based on the amount of the credit and the amount risked based on Reg T is generally considered the most accurate, reliable and representative form of measuring option spread PnL. As an example: Set up Sell a credit spread @ $1 Width: $5 How CML (and most of trading world, including broker-dealers and CBOE) does it: Amount risked: $5 (width) - $1 (credit) = $4 Max Loss in %: (Amount risked)/(Credit) = (4)/(1) = 400% Hopefully that makes sense. This is also how margin is calculated per Reg T.

