

Ophir Gottlieb
-
Posts
272 -
Joined
-
Last visited
-
Days Won
3
Content Type
Profiles
SteadyOptions Trading Blog
Forums
Everything posted by Ophir Gottlieb
-
Correct.
-
Yep, just a typo. Fixed.
-
Yep. I saw that too. I will correct story. Thanks, Chad.
-
OK. cool.
-
After Earnings: The Option Trade in NVIDIA Corporation (NASDAQ:NVDA) Date Published: 2017-05-09 Written by Ophir Gottlieb LEDE One option trade after NVIDIA Corporation (NASDAQ:NVDA) posts earnings has been a consistent winner and takes no earnings risk and no stock direction risk. NVIDIA Corporation Earnings While most of the focus is on the actual earnings move for a stock, that's the distraction when it comes to the option market. For NVIDIA Corporation, irrespective of whether the earnings move was up or down, if we waited two-days after the stock move, and then bought a 40/20 delta iron condor, the results were quite good and remarkably consistent over time. Note: A prior version of this article referenced 40/10 delta IC, that was incorrect -- this is a 40/20 IC. We can examine this, objectively, with a custom option back-test. Here is our earnings set-up: Rules * Open long Iron Condor 2 days after earnings * Close long Iron Condor 29 days later * Use the 30-day option Here are the results over the last year: That's a 113% return, with 7 winning trades and 4 losing trades. The total holding period was less than one full year. No earnings risk was taken, no stock direction risk was taken, but a long volatility bet was taken, after the vol crush. The Logic This strategy does not take stock direction risk, so bull or bear market, it "should" perform the same. Here's how this strategy did over two-years That's a 114% return, on 5 winning trades and 2 losing trades. We note the implication that it looks like between 3-years and 2-years ago, the strategy did very little since the return is essentially unchanged. Here's how it did over the last year: That's a 67.8% return on 2 winning trades and 2 losing trades. Finally, over the last six-months: Now it's a 47.9% return with 1 winning trade and 1 losing trade. It is interesting to note that the winning percentage has always hovered around 50%-70%, so this not a panacea. It is a strategy, which, over time, irrespective of the time frame, has created a sizable winning return. WHAT HAPPENED There are patterns to stock behaviors before and after earnings and those patterns reveal opportunities in the option market, without taking the actual risk of earnings. You can find them, stock by stock. This is how people profit from the option market -- it's preparation, not luck. To see how to do this for any stock we welcome you to watch this quick demonstration video: Tap Here to See the Tools at Work Thanks for reading. Risk Disclosure You should read the Characteristics and Risks of Standardized Options. Past performance is not an indication of future results. Trading futures and options involves the risk of loss. Please consider carefully whether futures or options are appropriate to your financial situation. Only risk capital should be used when trading futures or options. Investors could lose more than their initial investment. Past results are not necessarily indicative of future results. The risk of loss in trading can be substantial, carefully consider the inherent risks of such an investment in light of your financial condition. The author is long shares of NVIDIA Corporation (NASDAQ:NVDA) as of this writing. Back-test Link
-
OK. What was it?
-
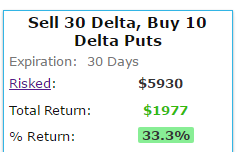
Also, if you run this over the last year, when the split had already occurred, the return is 33.3%, or annualized to 100%. The 3-year annualized to 92%.
-
Averages are coming.
-
Simply incorrect. This strategy takes 20 days per year (or whatever), which means the capital is free to be used for other trades. To report it as annualized without adjusting for that is wrong -- and it is not arguable. This is how returns are computed. Now, if the trade somehow required that money to be tied up, then we cannot annualize it -- but this is not the case.
-
Options Trading Before Earnings in Netflix Inc (NASDAQ:NFLX) Netflix Inc (NASDAQ:NFLX) : The Wonderful Secret to Options Trading Before Earnings Date Published: 2017-05-9 PREFACE There is a wonderful secret to trading options right before earnings announcements in Netflix Inc (NASDAQ:NFLX) , and really many stocks, that benefits from the rising implied volatility but avoids the risk into the actual earnings release and also avoids any kind of stock direction risk. STORY Everyone knows that the day of an earnings announcement is a risky event for a stock. This can be explicitly seen in the option market, where the implied volatility (the expected stock move) rises into the earnings event. The question every option trader, whether professional or amateur, has long asked is if there is a way to profit from this known volatility rise. It turns out, that over the long-run, for stocks with certain tendencies like Netflix Inc (NASDAQ:NFLX) the answer is actually, yes. Yes, there is a systematic way to trade this repeating phenomenon, without making a bet on earnings or stock direction. THE WONDERFUL SECRET What a trader wants to do is to see the results of buying an at the money straddle a few days before earnings, and then sell that straddle just before earnings. The goal, is two-fold: (i) to benefit from that known implied volatility rise, and (ii) to own the straddle for a very short period of time when the stock might move 'a lot,' but taking no earnings bets. If either of those two phenomena occur, there's a very good chance this wins, if neither occur, the amount risked is normally quite small. This trade is not a panacea, which is to say, we have to test it, stock by stock, to see when and why it worked. We start with Netflix Inc. Here is the setup: We are testing opening the position 6 days before earnings and then closing the position 1 day before earnings. This is not making any earnings bet. This is not making any stock direction bet. Once we apply that simple rule to our back-test, we run it on an at-the-money straddle: RETURNS If we did this long at-the-money (also called '50-delta') straddle in Netflix Inc (NASDAQ:NFLX) over the last three-years but only held it before earnings we get these results: Long At-the-Money Straddle * Monthly Options * Back-test length: three-years * Open 6-days Before Earnings * Close 1-day Before Earnings * Holding Period: 5-Days per Earnings Winning Trades: 5 Losing Trades: 7 Pre-Earnings Straddle Return: 15.1% Annualized Return: 92% We see a 15.1% return, testing this over the last 12 earnings dates in Netflix Inc. That's a total of just 60 days (5 days for each earnings date, over 12 earnings dates). That's an annualized rate of 92%. We can also see that this strategy hasn't been a winner all the time, rather it has won 5 times and lost 7 times, for a 42% win-rate and again, that 15.1% return in less than two-full months of trading. MORE TO IT THAN MEETS THE EYE While this strategy is benefiting from the implied volatility rise into earnings, what it's really doing is far more intelligent. The option prices for the at-the-money straddle will show very little time decay over this 5-day period, so what this strategy really does is buy "five days" of potential stock movement with what is actually fairly small downside risk. That means the ideal stocks for this strategy have a couple of common characteristics: (i) The companies rarely pre-announce earnings -- this is an investment that does not look to make an earnings bet, so an earnings pre-announcement is the opposite of what we're hoping for. (ii) The underlying stock price of these companies tend to move a lot (or some) as earnings approach and various institutions and traders shuffle the stock price around in anticipation of the earnings result. The more one sided the outside world starts betting on direction -- up or down, the better it is to own the straddle. WHAT HAPPENED This is it -- this is how people profit from the option market -- it's preparation, not luck. We hope, if nothing else, you have learned about Netflix Inc (NASDAQ:NFLX) and the idea of option trading and volatility ahead of earnings. You can do this for other stocks on your won using the back-tester: Tap Here to Learn More
-
Intelligent Options Trading: Right After Earnings in Netflix Inc (NASDAQ:NFLX) Netflix Inc (NASDAQ:NFLX) : Intelligent Options Trading: Right After Earnings Date Published: 2017-05-9 LEDE This is a simple option trade that starts two-days after Netflix Inc (NASDAQ:NFLX) earnings and lasts for the one month to follow, that has been a winner for 3 straight years. Netflix Inc (NASDAQ:NFLX) Earnings While the mainstream media likes to focus on the actual earnings move for a stock, that's the distraction when it comes to the option market. For Netflix Inc, irrespective of whether the earnings move was up or down, if we waited two-days after the stock move, and then sold a one-month out of the money put spread, the results were simply staggering. We use two-days to allow the stock to fully reach equilibrium post earnings. We can examine this intelligent approach, objectively, with a custom option back-test. Here is our earnings set-up: Rules * Open short put spread 2-days after earnings * Close short put spread 29 days later * Use the 30-day options RETURNS If we sold this out-of-the-money put spread in Netflix Inc (NASDAQ:NFLX) over the last three-years but only held it after earnings we get these results: Intelligent Short Put Spread * Monthly Options * Back-test length: three-years * Open 2-days After Earnings * Close 29-days Later * Holding Period: 28-Days per Earnings Winning Trades: 11 Losing Trades: 1 Post-Earnings Short Put Spread Return: 77% Annualized Return: 84% We see a 77% return, testing this over the last 12 earnings dates in Netflix Inc. That's a total of just 336 days (28 days for each earnings date, over 12 earnings dates). We can also see that this strategy hasn't been a winner all the time, rather it has won 11 times and lost 1 times, for a 92% win-rate. MORE TO IT THAN MEETS THE EYE While a short put spread is a strategy that gains profits if the underlying stock "doesn't go down a lot," there is more to this with Netflix Inc. What we're after with this approach is identifying companies that make their large stock move the day after earnings -- whether that's up or down -- and after that, find a sense of equilibrium in the stock price for the next month. This is what we find in Netflix Inc (NASDAQ:NFLX) . WHAT HAPPENED Traders that have a plan guess less. This is how people profit from the option market. Take a reasonable idea or hypothesis, test it, and apply lessons learned. We hope, if nothing else, you have learned about Netflix Inc (NASDAQ:NFLX) and the intelligence and methodology of option trading and this idea of equilibrium right after earnings. As a Steady Options member, you can try the tools out yourself on promotional pricing here: Try the back-tester
-
Ty, @Yowster
-
@Yowster can you send the URL back-test to support@cmlviz.com re: max loss > spread width?
-
The sign up page for Steady Options members is here: https://cmlviz.com/register/cml-trademachine-49-mo-promotion-so/
-
So, I am a "real statistician" or mathematician as it were. My application of machine learning to finance was endorsed by the head of Germany's artificial intelligence arm. I am also in SSRN. My background stems from my graduate work at Stanford University. I have also been a market maker on the NYSE ARCA and CBOE (remotely) floors, I am, and have been, considered one of the pioneers of ML in finance and was the earliest to note that neural networks worked better than the prevailing literature dictated, which, believe it or not, was a controversial back then. I showed unquestionably that NN did outperform SVM with enough data, which, to translate into English by using a different industry's own "ah ha" moment would be like proving that battery powered auto engines have greater torque and substantially more power than a combustion engine. It's obvious now, but I assure you it was not obvious before. I love cynicism! It brings intelligent discussion and an evolution to thought processes. I also know that back and forth discussions with non-scientists also brings out a form of cynic that is in fact, not cynical, but rather angry. I cannot, and choose not, to change an angry man's mind. The cynic that looks at the results and says, "hey, this feels like curve fitting," has a winning approach. The cynic that uses Stats 101 to prove a point, is one that assumes the counter party is foolish. Don't be that person. First, for people that really want to learn, one example of a back-test is not what we do. We publish thousands, yes thousands, a day to Google News. It is the accumulation of tens of thousands of back tests that inspire and power the facility to begin an analysis of backtests. A stat cynic that has cognition would know that one backtest, in and of itself, even if it was 1000 years of data, is not sufficient to say very much at all. That entire backtest is one data point, and thousands of data points, all at the same time. A trader inside the body of a mathematician would also note that going further back, say more than 2-years, is often less robust than a shorter time period. The pre earnings trades and the post earnings trades, are an amalgamation of analysis, that together deliver robustness. If one where to employ a trade strategy the idea is to create a portfolio of the trades, not one. As Kim does with Steady Options, no month is based on one trade, it’s based on a portfolio of trades. It's not in my nature to interfere with the learning process, so in that vein, I observe responses. I have read the forum broadly not just this thread. I can see traders at various levels, it's really wonderful what Kim has built here. I chime in now not to change the conversation, but to reassure the cynics that are on their path to improvement to feel confident in their questions but to note that there are people here who are not appropriate to add to your knowledge base. Good luck to all, friends. A quant back-tester is not a product for everyone. That's OK. I wish everyone success in trading. Our goal is to empower everyone with the tools and information the top 0.1% have so we can break the information asymmetry that has benefited the few at the expense of the many for far too long.
-
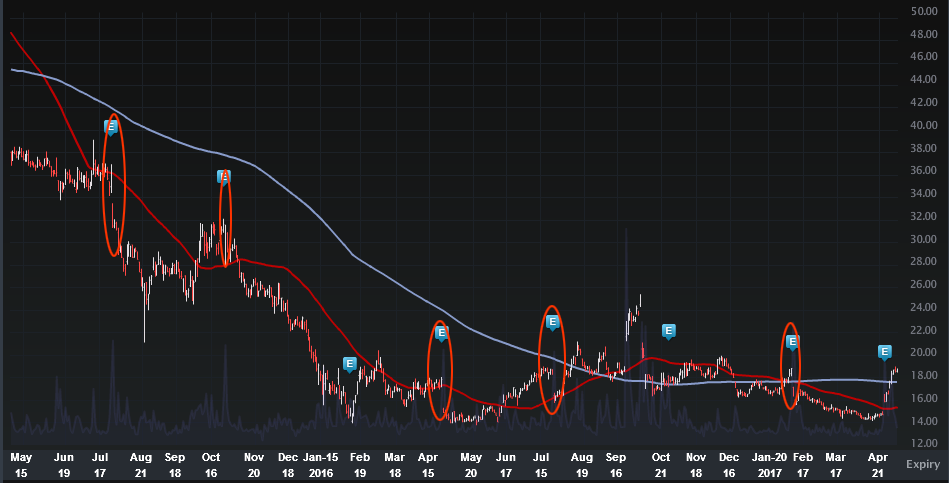
This Option Trade After Twitter Inc Earnings Has Been a Winner Date Published: 2017-05-08 Written by Ophir Gottlieb LEDE One option trade after Twitter Inc (NYSE:TWTR) posts earnings has been a consistent winner and takes no earnings risk and very little stock direction risk. Twitter Inc Earnings While most of the focus is on the actual earnings move for a stock, that's the distraction when it comes to the option market. For Twitter Inc, irrespective of whether the earnings move was up or down, if we waited on day after the stock move, and then sold an out of the money put spread, the results were simply staggering. We can examine this, objectively, with a custom option back-test. Here is our earnings set-up: Rules * Open short put spread 2 days after earnings * Close short put spread 29 days later * Use the 30-day option Here are the results over the last year: That's a 41.4% return, with 4 winning trades and 0 losing trades. The total holding period was less than 4 full months, meaning the annualized return was over 120%. No earnings risk was taken -- this is not a coin flip over earnings. The Logic This strategy works beautifully in Facebook, but with Twitter Inc, even naysayers can't criticize this strategy as only working because we're in a bull market. Twitter Inc stock has performed awfully post earnings. Here is a 2-year stock chart, where the earnings dates are designated by a "E" icon and circled in red: It's the exception, not the rule, when Twitter Inc (NYSE:TWTR) doesn't gap down off of earnings. But the logic behind this trade follows a narrative that even after a bad earnings release, if we wait two days after, we find the stock at a point of equilibrium. If it gapped down -- that gap is over. If it beat earnings, the downside move is already likely muted. Here's how this strategy has done over the last 6-months: That's a 11.5% return, on 2 winning trades and 0 losing trades. Since this is a total of a two-month holding period, that 11.5% is actually a 70% annualized. If you're curious, yes, this also produced positive returns over the last 3-years, even though the stock has so under-performed as a buy and hold investment, and done so poorly on earnings calls. WHAT HAPPENED There are patterns to stock behaviors before and after earnings and those patterns reveal opportunities in the option market, without taking the actual risk of earnings. You can find them, stock by stock, like Apple and Google before and after earnings. This is how people profit from the option market -- it's preparation, not luck. To see how to do this for any stock and for any strategy with just the click of a few buttons, we welcome you to watch this quick demonstration video: Tap Here to See the Tools at Work Thanks for reading. Risk Disclosure You should read the Characteristics and Risks of Standardized Options. Past performance is not an indication of future results. Trading futures and options involves the risk of loss. Please consider carefully whether futures or options are appropriate to your financial situation. Only risk capital should be used when trading futures or options. Investors could lose more than their initial investment. Past results are not necessarily indicative of future results. The risk of loss in trading can be substantial, carefully consider the inherent risks of such an investment in light of your financial condition. The author has no position in Twitter Inc (NYSE:TWTR) as of this writing. Back-test Link (does require custom earnings settings).
-
The days after earnings discrepancy was actually a time zone issue by user. It has been fixed and behaves as expected. By monthly options, I mean options as close as 30-days to expo, not the actual "monthlies."
-
Perfectly done.
-
The stop / limit bug was fixed a few days ago. We are looking at your question surrounding earnings dates.
-
We can take a look at that, but remember, options do decay over weekends as well (not like weekdays, but it's still a real factor).
-
The amount risked uses the margin requirements as defined by Reg T (in this case for a short spread) which are not affected by stop losses, so to answer the question directly: no. Here's more on that: Measuring 'Amount Risked' With Options The details behind Reg T, margin requirements, and how "amount risked" is calculated by TradeMachine.
-
This is not curve fitting. Here is Twitter -- an utter disaster on earnings: Same strategy over 3-year with a 100% stop loss. http://tm.cmlviz.com/index.php?share_key=ZiD5GyhkrYKM8vD8 And over one-year: http://tm.cmlviz.com/index.php?share_key=6D1Ebjv0J2brzKEG And the actual stock chart with the earnings disasters. 5 times out of the last 8 it has been a literal gap down, but still, do this trade, use a stop, avoid the gap (bc we wait until after earnings), and the return are rather large. Cynicism is at the heart of every good trader, but the unwillingness to welcome new data is at the heart of every failed trader. A portfolio of these short put spreads, even when earnings are awful, has worked exceedingly well. A bear market will not change this, as long as the stops are tight and the trades avoid the risk of earnings -- that's critical. In a bear we will see higher premium, making up for the added risk -- in fact, that's why the vol is higher.

-
Yep 30/10. Good catch. I will add that ti my articles, thank you.
-
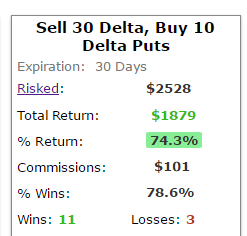
Options Intelligence: Post Earnings Trading in Ambarella Inc (NASDAQ:AMBA) Ambarella Inc (NASDAQ:AMBA) : Options Intelligence: Earnings Trading Date Published: 2017-05-5 LEDE This is a simple option trade that starts the day after Ambarella Inc (NASDAQ:AMBA) earnings and lasts for the one month to follow, that has been a winner for 3 straight years. Ambarella Inc (NASDAQ:AMBA) Earnings While the mainstream media likes to focus on the actual earnings move for a stock, that's the distraction when it comes to the option market. For Ambarella Inc, irrespective of whether the earnings move was up or down, if we waited one day after the stock move, and then sold an one-month out of the money put spread, the results were simply staggering. We can examine this, objectively, with a custom option back-test. Here is our earnings set-up: Rules * Open short put spread one day after earnings * Close short put spread 29 days later * Use the 30-day options RETURNS If we sold this out-of-the-money put spread in Ambarella Inc (NASDAQ:AMBA) over the last three-years but only held it after earnings we get these results: Short Put Spread * Monthly Options * Back-test length: three-years * Open 1-day After Earnings * Close 29-days Later * Holding Period: 30-Days per Earnings Winning Trades: 11 Losing Trades: 1 Post-Earnings Short Put Spread Return: 69.4% Annualized Return: 70% We see a 69.4% return, testing this over the last 12 earnings dates in Ambarella Inc. That's a total of just 360 days (30 days for each earnings date, over 12 earnings dates). We can also see that this strategy hasn't been a winner all the time, rather it has won 11 times and lost 1 times, for a 92% win-rate. Here are the results or the last year: Short Put Spread * Monthly Options * Back-test length: one-year * Open 1-day After Earnings * Close 29-days Later * Holding Period: 30-Days per Earnings Winning Trades: 4 Losing Trades: 0 Post-Earnings Short Put Spread Return: 28.6% Annualized Return: 85.8% So we can see it has worked for all of the most recent four earnings releases. This is not a panacea -- there is no guarantee this will work. What we see is that over time, this has worked quite consistently and we have a strong rationale to explain it. Here is that rationale. MORE TO IT THAN MEETS THE EYE While a short put spread is a strategy that gains profits if the underlying stock "doesn't go down a lot," there is more to this with Ambarella Inc. This strategy, and that's what it is, a strategy, not some weird promise of a silver bullet, does not take on the risk of earnings, and while it's slightly bullish, it really isn't a stock direction investment either. In many ways, earnings results are just a coin flip -- and we are not interested in flipping coins with option strategies. What we're after with this approach is identifying companies that make their large stock move the day after earnings -- whether that's up or down -- and after that, find a sense of equilibrium in the stock price for the next month. This is what we find in Ambarella Inc (NASDAQ:AMBA) . We can see that this idea has been a winner more times than it has been a loser -- a 92% win-rate. It's that positive win-rate that has created that large 70% annualized return. WHAT HAPPENED Traders that have a plan guess less. This is how people profit from the option market. Take a reasonable idea or hypothesis, test it, and apply lessons learned. We hope, if nothing else, you have learned about Ambarella Inc (NASDAQ:AMBA) and the intelligence and methodology of option trading and this idea of equilibrium right after earnings. To see how to do this for any stock and for any strategy with just the click of a few buttons, we welcome you to watch this quick demonstration video: Tap Here to See the Tools at Work Thanks for reading. The author is long shares of Ambarella Inc (NASDAQ:AMBA) at the time of this writing.Risk Disclosure You should read the Characteristics and Risks of Standardized Options. Past performance is not an indication of future results. Trading futures and options involves the risk of loss. Please consider carefully whether futures or options are appropriate to your financial situation. Only risk capital should be used when trading futures or options. Investors could lose more than their initial investment. Past results are not necessarily indicative of future results. The risk of loss in trading can be substantial, carefully consider the inherent risks of such an investment in light of your financial condition.
-
email support@cmlviz.com

