

Ophir Gottlieb
-
Posts
272 -
Joined
-
Last visited
-
Days Won
3
Content Type
Profiles
SteadyOptions Trading Blog
Forums
Everything posted by Ophir Gottlieb
-
All fixed.
-
Yes, we have a new bug in stops and limits. We're addressing tomorrow. But very good to know -- don't use stops and limits right now. This bug crept up with the new custom release today, which is weird, but, it happens.
-
It looks like MSFT is a reasonable candidate for the long / short straddle pre-earnings trade. http://tm.cmlviz.com/index.php?share_key=ixlLJiwwS3NrQZZt 2-years 1-year
-
We have identified what we are confident was the issue. It was related to the needing to upgrade existing users to the pro accounts. Everyone should be good to go. Please let us know if you continue having any problems through support@cmlviz.com
-
Yeah, we have had this report a few times. We're working on it -- hopefully a patch today. It's a little odd bc it works on most browers/computer combinations. We'll straighten it out, sorry for the trouble.
-
I created it, yes, but it's in my custom strategy folder, which is a drop down menu under 'custom strategies.' (coming at midnight).
-
Didn't understand your question exactly, but you can definitely save your strategies and even share them so they will be saved on someone else's TM.
-
Here you go. I believe this is Kim's approach. NVDA FB AMZN look incredible. This is $49 / mo today, $99 / mo starting tomorrow. https://cmlviz.com/register/cml-trademachine-49-mo-promotion-so/
-
-
You can share the link to your back-test and it will open up in everyone else's backtester as well.
-
Perfect analysis and sharing! Thank you!
-
Custom is being released tonight
-
We let out community decide. We do have plans for much more powerful risk charting. If you're a member you will receive a "what do you want email" soon.
-
Here it is! To be released tomorrow. cc @Kim Custom Option Strategy Building With the CMLviz Option back-tester As of tomorrow, this Pro version of the software will be $99. The $49 version will still exist, but the "automatic free upgrade" ends in a day. You can sign up as a Steady Options Member here: https://cmlviz.com/register/cml-trademachine-49-mo-promotion-so/
-
We are releasing tomorrow at midnight. Custom works, multi-ticker works, saving custom works, risk calcs work, front end works, no we are doing further automated testing on all.
-
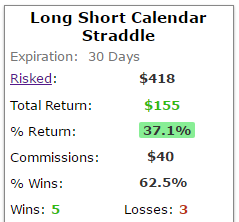
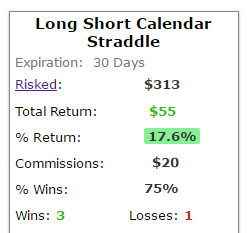
How to Profit from Workday Inc Volatility How to Profit from Workday Inc Volatility Date Published: 2017-06-09 PREFACE The market has a new-found volatility and that means the trusted long-only strategies may start to work less well. But, for the investor that is interested in turning a profit with some homework, this new found volatility does mark an opportunity for several stocks with options, and in this case study we look at Workday Inc (NYSE:WDAY). STORY There is always a way to trade options that benefits from market volatility -- that's not the issue -- the issue is how to avoid making the investment when the market is not volatile. What we're about to show you could make you angry -- but this is objective data -- and yes, this is how the hedge funds and algos make the top 0.1% richer at the expense of every other individual trader. Now it's time to do it ourselves. JOINING THE ELITE Simply buying near-the-money options and selling further out-of-the-money options is a trade that looks for market volatility. If we did it in Workday Inc, it would have been a disaster. Here are the results over the last 3-years: Yep -- a 50% loss over three-years while the stock was soaring. But there is a much smarter way to approach this and it's easiest seen with a stock chart. What we're looking at below is a 2-year stock chart for Workday Inc, with the earnings dates highlighted by the blue "E" icon, and circled. What we can see, totally irrespective of the earnings move, is that the month before earnings, the stock tends to trade with volatility. We can see that with the yellow arrows drawn in the month before each earnings announcement. Now, we don't care if the stock goes up or down, what we care about is that the stock does something. Watch what happens to our iron condor option strategy when we only trade the month before earnings. Here's the set-up, to be perfectly clear what we're testing: And here are the results: Go to this back-test That 50% losing trade, when we isolate it to just the month before earnings, now returned 92.8%. Yes, that is a total and utter reversal of the original approach and for the record, the stock itself is only up 29% in those three-years. The first attempt we checked is what everyone else is doing. The second approach is what the top 0.1% are doing. CONSISTENCY Here is how this pre-earnings iron condor has done over the last two-years: Go to this back-test That's a 82.4% return, with 5 wining trades and 3 losing trades. For completeness, here are the results over the last six-months, which is really just two earnings announcements, one-month before each, for a total of two-months of trading: Go to this back-test Now we see a 42% return in just two-months of trading, with the last two pre-earnings trades both winning. WHAT HAPPENED You have now seen the realities of option trading. The wealthiest and most successful funds and algos get ahead by using intelligence like this. If you have the desire to do it as well, then you too can find the patterns that drive profits and make option trading less about luck, and more about knowledge. This type of intelligence even works for covered calls and much less complex ideas than iron condors. To learn more, we welcome you to watch this quick demonstration video: Tap Here to See the Tools at Work Thanks for reading. Risk Disclosure You should read the Characteristics and Risks of Standardized Options. Past performance is not an indication of future results. Trading futures and options involves the risk of loss. Please consider carefully whether futures or options are appropriate to your financial situation. Only risk capital should be used when trading futures or options. Investors could lose more than their initial investment. Past result
-
We actually just had a quick team chat, and we will be doing parity at expiration. So, worthless is 0 and no transaction costs, and parity is execution price otherwise. The trade-off became easy. We may be a $0.04 too optimistic on executing at parity, but we will not be $1.75 wrong, or even $0.12 wrong. Excellent feedback and very much appreciated.
-
The only real issue I see here is the unfortunate $3.50 wide market on close (no bid). The 0.20 options that expired worthless are realistic for those that do not want exercise risk in BBRY. It is highly illiquid and this, to me, is a point of strength of the back-tester that others do not have. In theory, "they expire worthless,", in reality, not necessarily. We will look at that crazy wide market, but yet again, it is a symptom of the market for this security, which is what a proper back-tester should account for. We have the ability to put logic in for parity on expiration, that's obv not a big deal, but we have resisted that urge that try to keep market realities present. I think the best fix would be a setting that reads "let options expire worthless" for those that chose to go that route.
-
A large scale, full built scanner is in the works, but it's along ways off -- perhaps 6 months. But it will be able to scan anything -- like the best covered calls in Technology over 3 years with x wins, y return, z average return, etc, etc, etc
-
Yes. We will be a dding a 4th and 5th year soon.
-
Could not have said it better myself.
-
Trading Applied Optoelectronics Inc (NASDAQ:AAOI) Options Date Published: 2017-06-07 Written by Ophir Gottlieb LEDE Look, this could feel a little uncomfortable, not in that it's complex, it's actually quite easy and fun, but it is the difference between professional traders and non-professionals. And it's just not easy to read how a simple information gap can be the difference between the top 0.1% and everyone else, sometimes. Here we go. There is a way to trade Applied Optoelectronics Inc (NASDAQ:AAOI) options right after earnings that has been a winner without a loss for an entire year, and further has returned over 170% annualized returns in that time frame. The Trade After Earnings Selling a put spread in a stock that is rising, in hindsight, obviously looks like a great idea. Here is the stock price chart for Applied Optoelectronics Inc over the last two-years: We can see the stock that is ripping, but we have also labeled the earnings announcements with the blue "E" icon, and noted the two poor earnings results in yellow. Remember those two circled dates. If we had blindly sold an out-of-the-money put spread every month in Applied Optoelectronics over the last three-years, the results were actually not very impressive. We can see 30.2% return, while taking on a lot of risk. The next logical step is to try this same approach but simply avoid (skip) earnings days. Here are those results: We can see a nice improvement, going from a 30% return up to 43.8% and taking a lot less risk. But there's more going on here. It's a fair question to ask if trading every month is worth it -- is it profitable -- is it worth the risk? There's an action plan that measures this exactly, and the results are simply stunning. Let's test this idea: In English, let's see what would have happened if we sold this same put spread, but rather than trading every month, we simply traded the month right after earnings. More explicitly, the rules are: Rules * Open short put spread 2-days after earnings. * Close short put spread 29-days later. * Use the option that is closest to but greater than 30-days away from expiration. And here are the results of implementing this much finer strategy: Back-test Link All of a sudden, by removing the risk of earnings, and then removing the risk of 2 out of the other 3 months every quarter, we find option returns that have spiked to 82.4%. But of course, we can't just test an idea because it works -- there must be logic to what we're doing. And yes, there is sound logic to this approach to option trading. The Logic Our idea here is that after earnings are reported, and after the stock does all of its gymnastics, up or down, that two-days following the earnings move and for the next month, the stock is then in a quiet period. If it gapped down -- that gap is over. If it beat earnings, the downside move is already likely muted. If you recall that stock chart from the top, there were a couple of times that Applied Optoelectronics missed on earnings and fell hard. here is a zoomed in image of the earnings reported on 5-9-2016: The stock gapped down hard, losing more than 17% in a single day. But here's where our logic comes into play. If we're right, after two days of price movement, the stock should find a sort of equilibrium, and stop dancing around. We can see this exact phenomenon. The earnings date was May 9th, the trade entry date was 2-days later, May 11th. From that entry point to one month later when the trade closes, the stock rose. Yep, even after a terrible earnings release, once the bad news had its chance to play out, the stock was fine. And since a short put spread is simply a bet that the stock "won't go down a lot," this set-up has played perfectly. Here is how the strategy has done over the two-years: Back-test Link We see a 56.8% return over eight earnings cycles. But remember, since this trade is only live for one-month a quarter, that 56.8% return was actually just 8-months of trading, not two-years. Here's what we see over the last year: Back-test Link Now we see a 46.4% return over the last four earnings cycles, but the beauty of this approach has not just been superior returns, it doesn't tie up capital for months that aren't profitable. Since this was just four-months of trading, that's over 170% annualized returns. WHAT HAPPENED To see how to do this for any stock and for any strategy with just the click of a few buttons, we welcome you to watch this quick demonstration video: Tap Here to See the Tools at Work Thanks for reading. Risk Disclosure You should read the Characteristics and Risks of Standardized Options. Past performance is not an indication of future results. Trading futures and options involves the risk of loss. Please consider carefully whether futures or options are appropriate to your financial situation. Only risk capital should be used when trading futures or options. Investors could lose more than their initial investment. Past results are not necessarily indicative of future results. The risk of loss in trading can be substantial, carefully consider the inherent risks of such an investment in light of your financial condition. The author has no position in Applied Optoelectronics Inc (NASDAQ:AAOI) as of this writing. Back-test Link
-
ty, Kim.
-
ty
