

Ophir Gottlieb
-
Posts
272 -
Joined
-
Last visited
-
Days Won
3
Content Type
Profiles
SteadyOptions Trading Blog
Forums
Everything posted by Ophir Gottlieb
-
The Pattern in Facebook Stock Ahead of Earnings Date Published: 2017-06-26 Written by Ophir Gottlieb Lede This is a continuation of our discussion on Alphabet Inc (NASDAQ:GOOGL). There is a powerful pattern in Facebook Inc (NASDAQ:FB) stock ahead of earnings that has meant a wonderful return in the option market. The strategy won't work forever, but for now it appears to be a momentum play. Preface As we discussed with Alphabet Inc, one of the least recognized yet most important phenomena surrounding this market run by the mega technology stocks is the amount of optimism that sets in the two weeks before an earnings announcement. That is, totally irrespective of whether the stocks have a history of beating earnings, in the two-weeks before of earnings, several of them tend to rally abruptly into the event. There has been a way to profit from this pattern without taking any actual earnings risk -- and it is very powerful in Facebook Inc (NASDAQ:FB). The Trade Before Earnings Let's look at buying a monthly call option in Facebook Inc two-weeks before earnings and selling the call before the earnings announcement. Here's the set-up in great clarity; again, note that the trade closes before earnings, so this trade does not make a bet on the result of the earnings result. Now, unlike many of our other set-ups, this is in fact a straight down the middle bullish bet -- this absolutely takes on directional stock risk, so let's be conscious of that before we see the results, because they are mind bending. Here are the results over the last two-years in Alphabet Inc: Go to the back-test link The trade has won 6 of the last 8 earnings pre-earnings cycles -- so this isn't some silver bullet (6 wins, 2 losses). But, the trade has won 75% of the time, and the return has been a staggering 670%. The fascinating part here is that each winning trade averaged more twice as much as the losing trades, or in English, this trades wins 3 times more often it loses and the wins are twice as large as the losses, and that's how you find a trade with a 670% return. Note on Risk Reduction As a point of note, when we run this back-test using a limit gain of 30%, or in English, we close the position if it is ever up 30%, we avoid one of the losses, and this turns into a strategy that has won 7 of the last 8 earnings cycles: Go to the back-test link We note here that the Alphabet Inc (NASDAQ:GOOGL) long call ahead of earnings also won 7 of the last 8 times and the losing quarter for GOOGL was not the same losing quarter for FB, so if these two were used together as a portfolio of pre-earnings calls, the combined strategy would have won all 16 times (eight quarters each). Checking More Time Periods Now we can look at just the last year as well (using no stops or limits): Go to the back-test link We're now looking at 324% returns on 4 winning trades and 0 losing trades. It's worth noting again that we are only talking about two-weeks of trading for each earnings release, so this 324% in just 8-weeks of total trading. For completeness, we include the results over the two most recent earnings events (6-months). Go to the back-test link That's 294% on 4-weeks of trading without once taking the risk of an actual earnings release. WHAT HAPPENED Bull markets have quirks, or personalities if you like. The personality of this bull is mega cap tech heavy and full of optimism before earnings -- irrespective of the actual earnings result. This is how people profit from the option market -- it's preparation, not luck. To see how to do this for any stock and for any strategy, including covered calls, with just the click of a few buttons, we welcome you to watch this quick demonstration video: Tap Here to See the Tools at Work Thanks for reading. Risk Disclosure You should read the Characteristics and Risks of Standardized Options. Past performance is not an indication of future results. Trading futures and options involves the risk of loss. Please consider carefully whether futures or options are appropriate to your financial situation. Only risk capital should be used when trading futures or options. Investors could lose more than their initial investment. Past results are not necessarily indicative of future results. The risk of loss in trading can be substantial, carefully consider the inherent risks of such an investment in light of your financial condition. The author has no position in Facebook Inc (NASDAQ:FB) as of this writing. Go to the back-test link
-
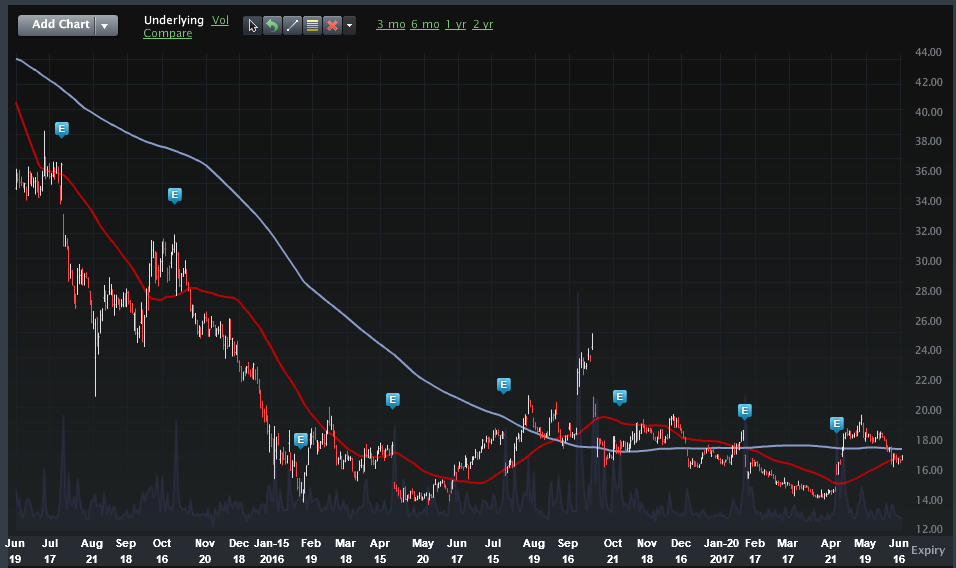
The Unbelievable Pattern in Alphabet Stock Ahead of Earnings Date Published: 2017-06-23 Written by Ophir Gottlieb Lede There is an unbelievable pattern in Alphabet Inc (NASDAQ:GOOGL) stock ahead of earnings that has meant a wonderful return in the option market. Preface One of the least recognized yet most important phenomena surrounding this market run by the mega technology stocks is the amount of optimism that sets in the two weeks before an earnings announcement. That is, totally irrespective of whether the stocks have a history of beating earnings, in the two-weeks before of earnings, several of them tend to rally abruptly into the event. There has been a way to profit from this pattern without taking any actual earnings risk -- and it is simply staggering in Alphabet Inc (NASDAQ:GOOGL). This is how people profit from the option market -- it's attention to detail rather than hope. The Trade Before Earnings Let's look at a simple idea -- buying a monthly call option in Alphabet Inc two-weeks before earnings and selling the call before the earnings announcement. Here's the set-up in great clarity; again, note that the trade closes before earnings, so this trade does not make a bet on the result of the earnings result. Now, unlike many of our other set-ups, this is in fact a straight down the middle bullish bet -- this absolutely takes on directional stock risk, so let's be conscious of that before we see the results, because they are mind bending. Here are the results over the last two-years in Alphabet Inc: Go to the back-test link I know it seems absurd, but the trade has won 7 of the last 8 earnings pre-earnings cycles, for a 895% return. We can look at the last year as well: Go to the back-test link We're now looking at 377% returns on 4 winning trades and 0 losing trades. It's worth noting again that we are only talking about two-weeks of trading for each earnings release, so this 377% in just 8-weeks of total trading. For completeness, we include the results over the two most recent earnings events (6-months). Go to the back-test link That's 209% on 4-weeks of trading without once taking the risk of an actual earnings release. THE STOCK CHART We can look at Alphabet Inc's stock chart to see what's happening -- that is, to see the optimism (The blue "E" icons represent earnings). Note that the yellow arrows show the stock rise ahead of earnings, and we even box the times that the post earnings move was poor: What is so fascinating about this chart is that the stock does not necessarily follow through after earnings. We have boxed the times when GOOGL stock actually tanked after earnings -- but it has not upset the pattern of optimism for the next pre-earnings move. If you're wondering if this works for other mega tech names, the answer is yes. We will cover those for subscribers only in the coming days and combining them, that is, taking a position in more than one, alleviates the risk of a "coin flip" miss. That's the approach we want to take. Even further, all of the results we looked at were using a 50% stop loss -- that means if the calls that were purchased ever saw losses, we just closed the potion out and moved on. WHAT HAPPENED This is how people profit from the option market -- it's preparation, not luck. It's attention to detail rather than hope. To see how to do this for any stock and for any strategy, including covered calls, with just the click of a few buttons, we welcome you to watch this quick demonstration video: Tap Here to See the Tools at Work Thanks for reading. Risk Disclosure You should read the Characteristics and Risks of Standardized Options. Past performance is not an indication of future results. Trading futures and options involves the risk of loss. Please consider carefully whether futures or options are appropriate to your financial situation. Only risk capital should be used when trading futures or options. Investors could lose more than their initial investment. Past results are not necessarily indicative of future results. The risk of loss in trading can be substantial, carefully consider the inherent risks of such an investment in light of your financial condition. The author has no position in Alphabet Inc (NASDAQ:GOOGL) as of this writing. Go to the back-test link
-
Timing Red Hat Options Around Earnings Date Published: 2017-06-21 Written by Ophir Gottlieb LEDE Red Hat Inc (NYSE:RHT) just beat earnings and the stock is ripping to new all-time highs, but the real opportunity with options wasn't earnings -- it's right after earnings. The Trade After Earnings Selling a put spread every month in a stock that is rising, in hindsight, obviously looks like a great idea. But, there is a lot of risk in that trade, namely, the risk of an abrupt stock drop and a market sell-off that takes all stocks with it. So, we want to reduce the risk while not affecting the returns. One of our go to trade set-ups starts by asking the question if trading every month is worth it -- is it profitable -- is it worth the risk? There's an action plan that measures this exactly, and the results are powerful not just for Red Hat Inc, but for Apple Inc (NASDAQ:AAPL), Facebook Inc (NASDAQ:FB) and Alphabet Inc (NASDAQ:GOOGL) as well. Let's test the idea of selling a put spread only in the month after earnings. Here's what we mean: Our idea here is that after earnings are reported, and after the stock does all of its gymnastics, up or down, that two-days following the earnings move and for the next month, the stock is then in a quiet period. If it gapped down -- that gap is over. If it beat earnings, the downside move is already likely muted. Here is the set-up: More explicitly, the rules are: Rules * Open short put spread 2-days after earnings. * Close short put spread 29-days later. * Use the option that is closest to but greater than 40-days away from expiration. And here are the results of implementing this much finer strategy: Tap Here to See the Actual Back-test We see a 29.4% winner that only traded the month following earnings and took no risk at all other times. The trade has won 7 of the last 8 times, or a 87.5% win-rate. Here is how the strategy has done over the last year: Back-test Link It turns out the return is really coming from a streak of wins in the last year. We see a 47.5% return, winning each of the last four earning cycles. That 47.5% return is based on just 4-months of trading, so it's more than 160% in annualized returns. Here's what we see over the last six-months: Back-test Link Now we see a 28.9% return over the last two earnings cycles, winning both times. As an aside, this logic of finding the month of lowest risk to sell put spreads also worked remarkably well and remarkably similarly across the board in Apple Inc, Facebook Inc and Alphabet Inc. Back-test Link WHAT HAPPENED This is it. This is just one of the ways people profit from the option market -- optimize returns and reduce risk. To see how to do this for any stock and for any strategy, including covered calls, with just the click of a few buttons, we welcome you to watch this quick demonstration video: Tap Here to See the Tools at Work Thanks for reading. Risk Disclosure You should read the Characteristics and Risks of Standardized Options. Past performance is not an indication of future results. Trading futures and options involves the risk of loss. Please consider carefully whether futures or options are appropriate to your financial situation. Only risk capital should be used when trading futures or options. Investors could lose more than their initial investment. Past results are not necessarily indicative of future results. The risk of loss in trading can be substantial, carefully consider the inherent risks of such an investment in light of your financial condition. The author has no position in Red Hat Inc as of this writing. Back-test Link
-
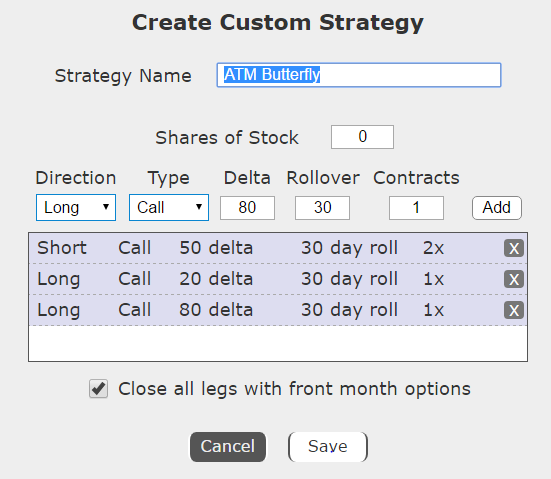
Sure. Here is an ATM butterfly: http://tm.cmlviz.com/index.php?share_key=TwIYaGU9I8ejF6yo This is AMZN over the last 3-years

-
I like this, but just note that it is, without question, a bullish stance, unlike some of the other ideas we discuss here which tend to be less stock direction biased. Having said that, one of my favorite approaches is to look at trades that win a lot, and try them until they lose, then I simply move on. I know my last trade will be a loss, that's my trigger to move on, but until then I can try some momentum. I just don't let myself dig a hole by trying over and over again with a loser that is stock direction biased.
-
Let's keep support questions to our support staff (support@cmlviz.com). You'll get faster answers than waiting for me to check this board. Happy to help there if it requires my attention as well.
-
Thank you so much, Guy. I'm very happy to hear it.
-
We are still working on risk for odd situations (like this). We're getting there, making nice progress every day. Thanks for all your feedback!.
-
I mean, this is a two-year stock chart (down 55%).
-
Showing a stock that has gone up for 3-years working on a short put spread is easy -- it's a real strategy when it works for stocks that have collapsed. I'm not looking for good bc up is up -- I'm looking for a win, irrespective of broad stock direction. Show me a collapsing stock that has a period where a short p/s works -- OK, now you have my attention.
-
 Trading Patterns of Optimism Has Meant Remarkable Returns for Twitter Inc Date Published: 2017-06-19 Written by Ophir Gottlieb LEDE Twitter Inc (NYSE:TWTR) has a pattern of missing earnings and a stock drop after the fact. But, the incredible phenomenon comes right before earnings -- no matter how many times Twitter disappoints, optimism tends to build just before the earnings release, and that is a tradeable phenomenon. This is how people profit from the option market -- it's attention to detail rather than hope. The Trade Before Earnings Selling a put spread is simply a bet that a stock "won't go down very much." Doing so Twitter has been a disaster -- as the stock has fallen so has a short put spread trader been eviscerated. But we don't care about the stock movements on whole, what we care about is a repeatable pattern and for Twitter that has meant optimism, or least a lack of pessimism, ahead of earnings. THE TRADE What we want to test is selling at out-of-the-money put spread in Twitter two-weeks before earnings which expires before earnings. We don't want to make an earnings bet, we simply want to ride the immoveable optimism in the stock right before earnings. Here is the set-up: And here are the results, side-by-side with selling a put spread every month. Go to the back-test link We see a 59% losing trade turn into a 72.7% winning trade and we also see the win-rate go from 64% to 83%. Even further, the left-hand side required trading every two-weeks for three-full years, whereas this pre-earnings trade only happened 12 times (one for each earning release) for a total of 24-weeks of trading. Consistent This "optimism," or really, "lack of pessimism," in Twitter stock right before earnings has been a consistent pattern. Here are the results over the last two-years: Go to the back-test link We're now looking at nearly 29% returns on 6 winning trades and 2 losing trades. It's worth noting again that we are only talking about two-weeks of trading for each earnings release, so this 29% in just 24-weeks. For completeness, we include the results over the two most recent earnings events (6-moths). Go to the back-test link That's 25% on 4-weeks of trading or a whopping 325% annualized return without once taking the risk of an actual earnings release. WHAT HAPPENED This is how people profit from the option market -- it's preparation, not luck. It's attention to detail rather than hope. To see how to do this for any stock and for any strategy, including covered calls, with just the click of a few buttons, we welcome you to watch this quick demonstration video: Tap Here to See the Tools at Work Thanks for reading. Risk Disclosure You should read the Characteristics and Risks of Standardized Options. Past performance is not an indication of future results. Trading futures and options involves the risk of loss. Please consider carefully whether futures or options are appropriate to your financial situation. Only risk capital should be used when trading futures or options. Investors could lose more than their initial investment. Past results are not necessarily indicative of future results. The risk of loss in trading can be substantial, carefully consider the inherent risks of such an investment in light of your financial condition. The author has no position in Twitter Inc (NYSE:TWTR) as of this writing. Go to the back-test link
 -
Trading Patterns of Optimism Has Meant Remarkable Returns for Twitter Inc Date Published: 2017-06-19 Written by Ophir Gottlieb LEDE Twitter Inc (NYSE:TWTR) has a pattern of missing earnings and a stock drop after the fact. But, the incredible phenomenon comes right before earnings -- no matter how many times Twitter disappoints, optimism tends to build just before the earnings release, and that is a tradeable phenomenon. This is how people profit from the option market -- it's attention to detail rather than hope. The Trade Before Earnings Selling a put spread is simply a bet that a stock "won't go down very much." Doing so Twitter has been a disaster -- as the stock has fallen so has a short put spread trader been eviscerated. But we don't care about the stock movements on whole, what we care about is a repeatable pattern and for Twitter that has meant optimism, or least a lack of pessimism, ahead of earnings. THE TRADE What we want to test is selling at out-of-the-money put spread in Twitter two-weeks before earnings which expires before earnings. We don't want to make an earnings bet, we simply want to ride the immoveable optimism in the stock right before earnings. Here is the set-up: And here are the results, side-by-side with selling a put spread every month. Go to the back-test link We see a 59% losing trade turn into a 72.7% winning trade and we also see the win-rate go from 64% to 83%. Even further, the left-hand side required trading every two-weeks for three-full years, whereas this pre-earnings trade only happened 12 times (one for each earning release) for a total of 24-weeks of trading. Consistent This "optimism," or really, "lack of pessimism," in Twitter stock right before earnings has been a consistent pattern. Here are the results over the last two-years: Go to the back-test link We're now looking at nearly 29% returns on 6 winning trades and 2 losing trades. It's worth noting again that we are only talking about two-weeks of trading for each earnings release, so this 29% in just 24-weeks. For completeness, we include the results over the two most recent earnings events (6-moths). Go to the back-test link That's 25% on 4-weeks of trading or a whopping 325% annualized return without once taking the risk of an actual earnings release. WHAT HAPPENED This is how people profit from the option market -- it's preparation, not luck. It's attention to detail rather than hope. To see how to do this for any stock and for any strategy, including covered calls, with just the click of a few buttons, we welcome you to watch this quick demonstration video: Tap Here to See the Tools at Work Thanks for reading. Risk Disclosure You should read the Characteristics and Risks of Standardized Options. Past performance is not an indication of future results. Trading futures and options involves the risk of loss. Please consider carefully whether futures or options are appropriate to your financial situation. Only risk capital should be used when trading futures or options. Investors could lose more than their initial investment. Past results are not necessarily indicative of future results. The risk of loss in trading can be substantial, carefully consider the inherent risks of such an investment in light of your financial condition. The author has no position in Twitter Inc (NYSE:TWTR) as of this writing. Go to the back-test link
-
That's right. But as an aside, 50 delta custom strategies will always choose the same strike, so it will be correct.
-
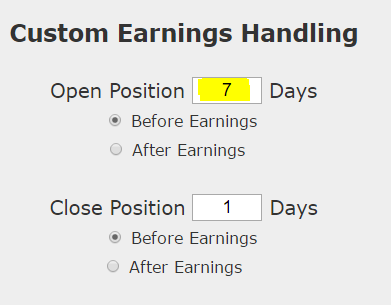
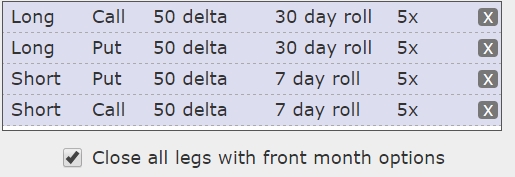
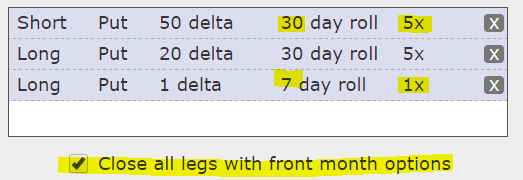
Hey guys, I am answering a bunch of questions at once here, so take your time perusing this post. 1. Earnings timing: If you want your strategy to use options that expire AFTER earnings, even if you are closing the position before earnings using the custom earnings handling make sure: Rollover >= Open Days Before Earnings Examples: Open Days Before Earnings Rollover Expiration Time 10 7 Select an expiry that expires before earnings 7 7 Select an expiry that expires after earnings 29 30 Select an expiry that expires after earnings So, in a meaningful example, let's pretend we wanted to open a strategy 7 days before earnings AND we want the options to have expirations AFTER earnings. We stat with this: And we make our rollover is 7 days or more, so this is ok: This will buy a monthly straddle and sell a weekly straddle but both expirations chosen will be AFTER earnings. If, instead, you wanted the short straddle to expire BEFORE earnings, then you could make the rollover 6 days or make the "open position days before earngins" 8 days. 2. Rolling options before the they expire An example here is selling a put spread with 30 day options but rolling it every 7 days (or whatever). There is a way to test it, however it requires a trick. Here it is the custom strategy: What we have done here is entered a credit spread with 30 options (for example) and then added a 7 day option with a trivial delta (to keep the price low). Then we have 'checked the box that reads "Close all legs with front month options". This will force the 30 day option spreads to close with the 7 day option, and then it will all roll again. If you use this as a proxy for your back-test, note your commissions and adjust them a little. We used a 5-lot credit spread and only a 1-lot weekly option to reduce the unintended commissions. Since you are testing a spread, this will have no impact on your "amount risked" and since it's a very cheap option (1 delta) it should have very little effect on your return %. This is a bit of trick here, but it works extremely well. 3. Days before earnings and after earnings We use TRADING days up to 7 days. So: Earnings Day Day Before Day After Monday Friday Tuesday Tuesday Monday Wednesday Wednesday Tuesday Thursday Thursday Wednesday Friday Friday Thursday Monday Also, "0 Days Before Earnings" and "0 Days After Earnings" are the same day OK, that's it! Happy Sunday to tall!
-
Just tell me what the trade is and I'll show. But be specific.
-
Give me a clear example - I think there is a way to do it.
-
Timing Is Everything With Options Date Published: 2017-06-15 Written by Ophir Gottlieb LEDE With the market selling off and mega tech especially under fire, we need to examine when being short options is appropriate -- or at least has been most appropriate in the past. Microsoft Corporation (NASDAQ:MSFT) is the long forgotten mega cap while media darlings Apple Inc, Facebook Inc, and Alphabet Inc garner all the headlines. But the lack of attention hasn't removed the opportunity in options, especially after earnings. The difference between professional traders and non-professionals is usually access to information and mindset. We can address both with this analysis on Microsoft Corporation where we look at an option trade right after earnings that has been a winner without a loss for an entire year, and has been a loser only once in the last three-years. The Trade After Earnings It's a fair question to ask if trading options every month is worth it -- is it profitable -- is it worth the risk -- especially now. So, there's an action plan that measures this exactly, and the results are powerful not just for Microsoft, but for Apple Inc (NASDAQ:AAPL), Facebook Inc (NASDAQ:FB) and Alphabet Inc (NASDAQ:GOOGL) as well. Let's test the idea of selling a put spread only in the month after earnings. Here's what we mean: Our idea here is that after earnings are reported, and after the stock does all of its gymnastics, up or down, that two-days following the earnings move and for the next month, the stock is then in a quiet period. If it gapped down -- that gap is over. If it beat earnings, the downside move is already likely muted. Here is the set-up: More explicitly, the rules are: Rules * Open short put spread 2-days after earnings. * Close short put spread 29-days later. * Use the option that is closest to but greater than 30-days away from expiration. And here are the results of implementing this much finer strategy: Back-test Link It's almost too good to be true -- a 71.6% return on 12 trades, where 11 were winners. We do note that the one loser came in February 2016 where the test sold a 53/50 strike put spread at $0.66 and ended up buying it back for $1.53 -- so a $0.87 loss on an original $0.66 credit. All the other trades over the last three-years were winners. Here's what we see over the last year: Back-test Link Now we see a 42.2% return over the last four earnings cycles, but the beauty of this approach has not just been superior returns, it doesn't tie up capital for months that aren't profitable. Since this was just four-months of trading, that's over 160% annualized returns. Finally, here are the last two earnings cycles (six-months): Back-test Link Remarkably consistent -- with a 22.1% over six-months and 42.2% over the last year. As an aside, this logic of finding the month of lowest risk to sell put spreads also worked remarkably well and remarkably similarly across the board in Apple Inc, Facebook Inc and Alphabet Inc. Back-test Link WHAT HAPPENED To see how to do this for any stock and for any strategy, including covered calls, with just the click of a few buttons, we welcome you to watch this quick demonstration video: Tap Here to See the Tools at Work Thanks for reading. Risk Disclosure You should read the Characteristics and Risks of Standardized Options. Past performance is not an indication of future results. Trading futures and options involves the risk of loss. Please consider carefully whether futures or options are appropriate to your financial situation. Only risk capital should be used when trading futures or options. Investors could lose more than their initial investment. Past results are not necessarily indicative of future results. The risk of loss in trading can be substantial, carefully consider the inherent risks of such an investment in light of your financial condition. The author has no position in Microsoft Corporation (NASDAQ:MSFT) as of this writing. Back-test Link
-
It's a very crowded trade so when it turns bad it can be magnified, but basically it has worked for almost a decade. I have a really simple approach which has made my trading IQ much higher: If I like a trade that has worked for a long time in a row, I go ahead and do it until it loses without worrying 'when it will stop.' I know that my last trade will be a loser, but until then I get to ride a wave without any real mental pain.
-
Yes. We show the spot in the trade details but options are based on futures, which means all option trades in the back-test are based on futures.
-
We do not have futures prices in the Trade Machine, which means we are showing spot prices.
-
The delta of a VIX option is based on the futures price, not the spot. This is not an oddity with our software, this is what put-call parity commands, bc the futures are tradeable while the spot is not. If you are looking at 90 days out, then it makes perfect sense that a 40 delta put would be the 21 strike while the spot was 20. It's likely that the futures index was ~25, so a 21 strike as 40 delta sounds right. You can also use the VXX, which is a bet on contango and has been a winning call spread sale for all 9-years the ETN has existed.
-
Great!
-
This is not support. Please email support@cmlviz.com and please include the link to your back-test (if you don't send a link, support will simply reply "please send a link to your back-test). This is where you can share your back-test link.
-
Stock splits should be fine. Can you send a link to your back-test and show us the place where it looks wrong? Also, please email support@cmlviz.com
