SBatch
-
Posts
5925 -
Joined
-
Last visited
-
Days Won
189
Content Type
Profiles
SteadyOptions Trading Blog
Forums
Everything posted by SBatch
-
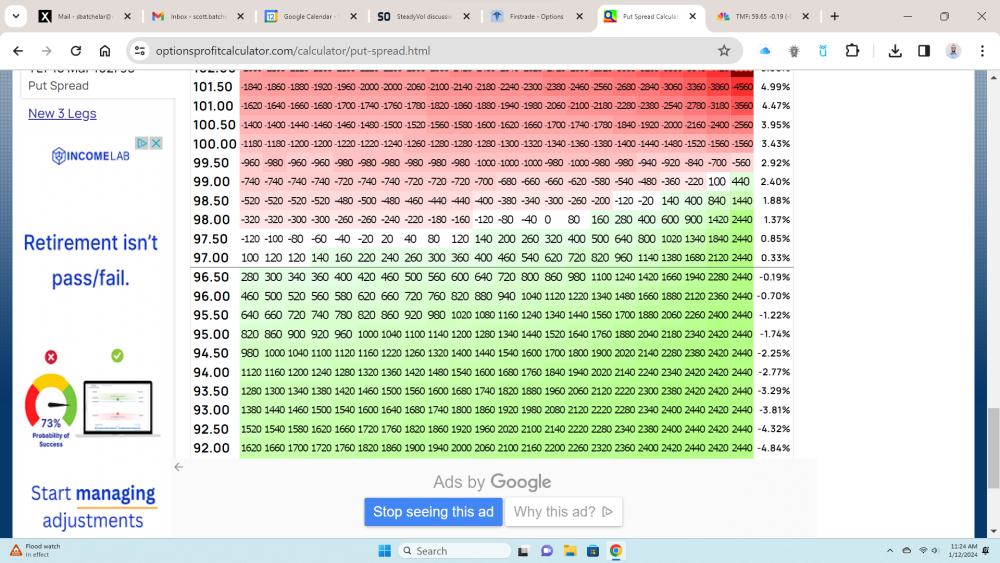
Options Profit Calculator now offers an ad-free paid version of their calculator. The basic calculator cost $7.95 per month. This is an extremely good deal for a very solid calculator: https://app.opcalc.com/get-opcalc-pro
-
I keep the max estimated drawdown to around 20%.
-
Yes, here is one done by a member: At the end, here are the results, backtests of the strategy over the last 20 years : Mean RMSE = 3.36%.
-
Personally, I have TLT between 90 and 95 over the course of the next three weeks.
-
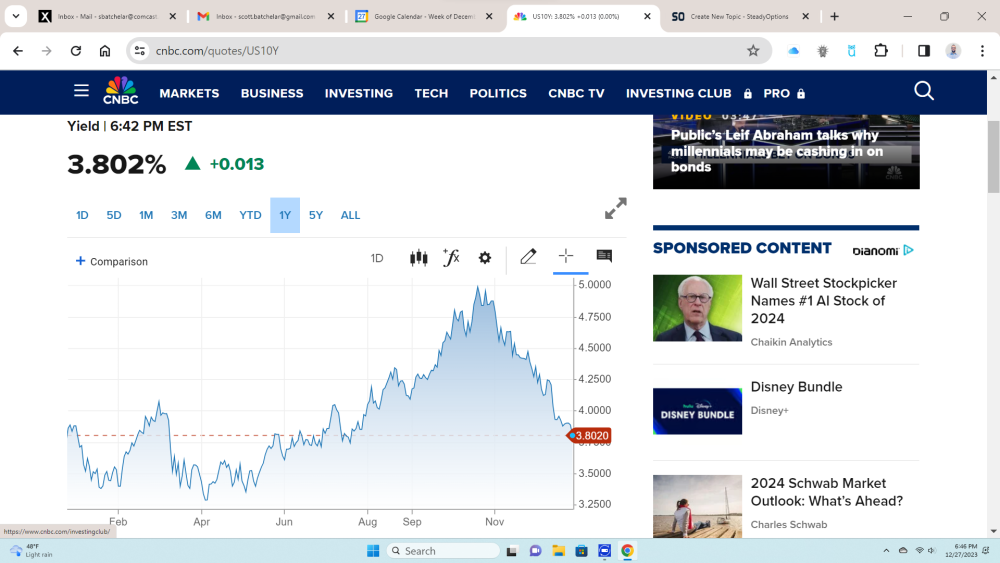
The above is an excellent chart of the correlation. As can be seen. The correlation is extremely strong until the pandemic, where yields needed to forge out an even lower low. However, as soon as that correction was made, the two synced right back up again.
-
Correct. There are fundamental issues such as inflation that can dislodge the correlation in the short term, but they always link up again at some point.
-
Treasuries are the trailer, not crude. And yes, the time delay is necessary to determine the correlation.
-
Please follow the official thread on the active trade from this point forward: https://steadyoptions.com/forums/forum/topic/9497-discussion-tlt-march-2024-iron-condor/?tab=comments#comment-190467
-
Holding as is.
-
If anyone is following the unofficial Iron Condor, I bought back the call spread for .20. 01/18/2024 13:13:30 01/18/2024 13:13:30 Sell Close Buy Close 20 20 TLT 03/15/2024 102.00 Call TLT 03/15/2024 100.00 Call Net Debit 0.20 DAY Sold @ 0.28 Bought @ 0.48
-
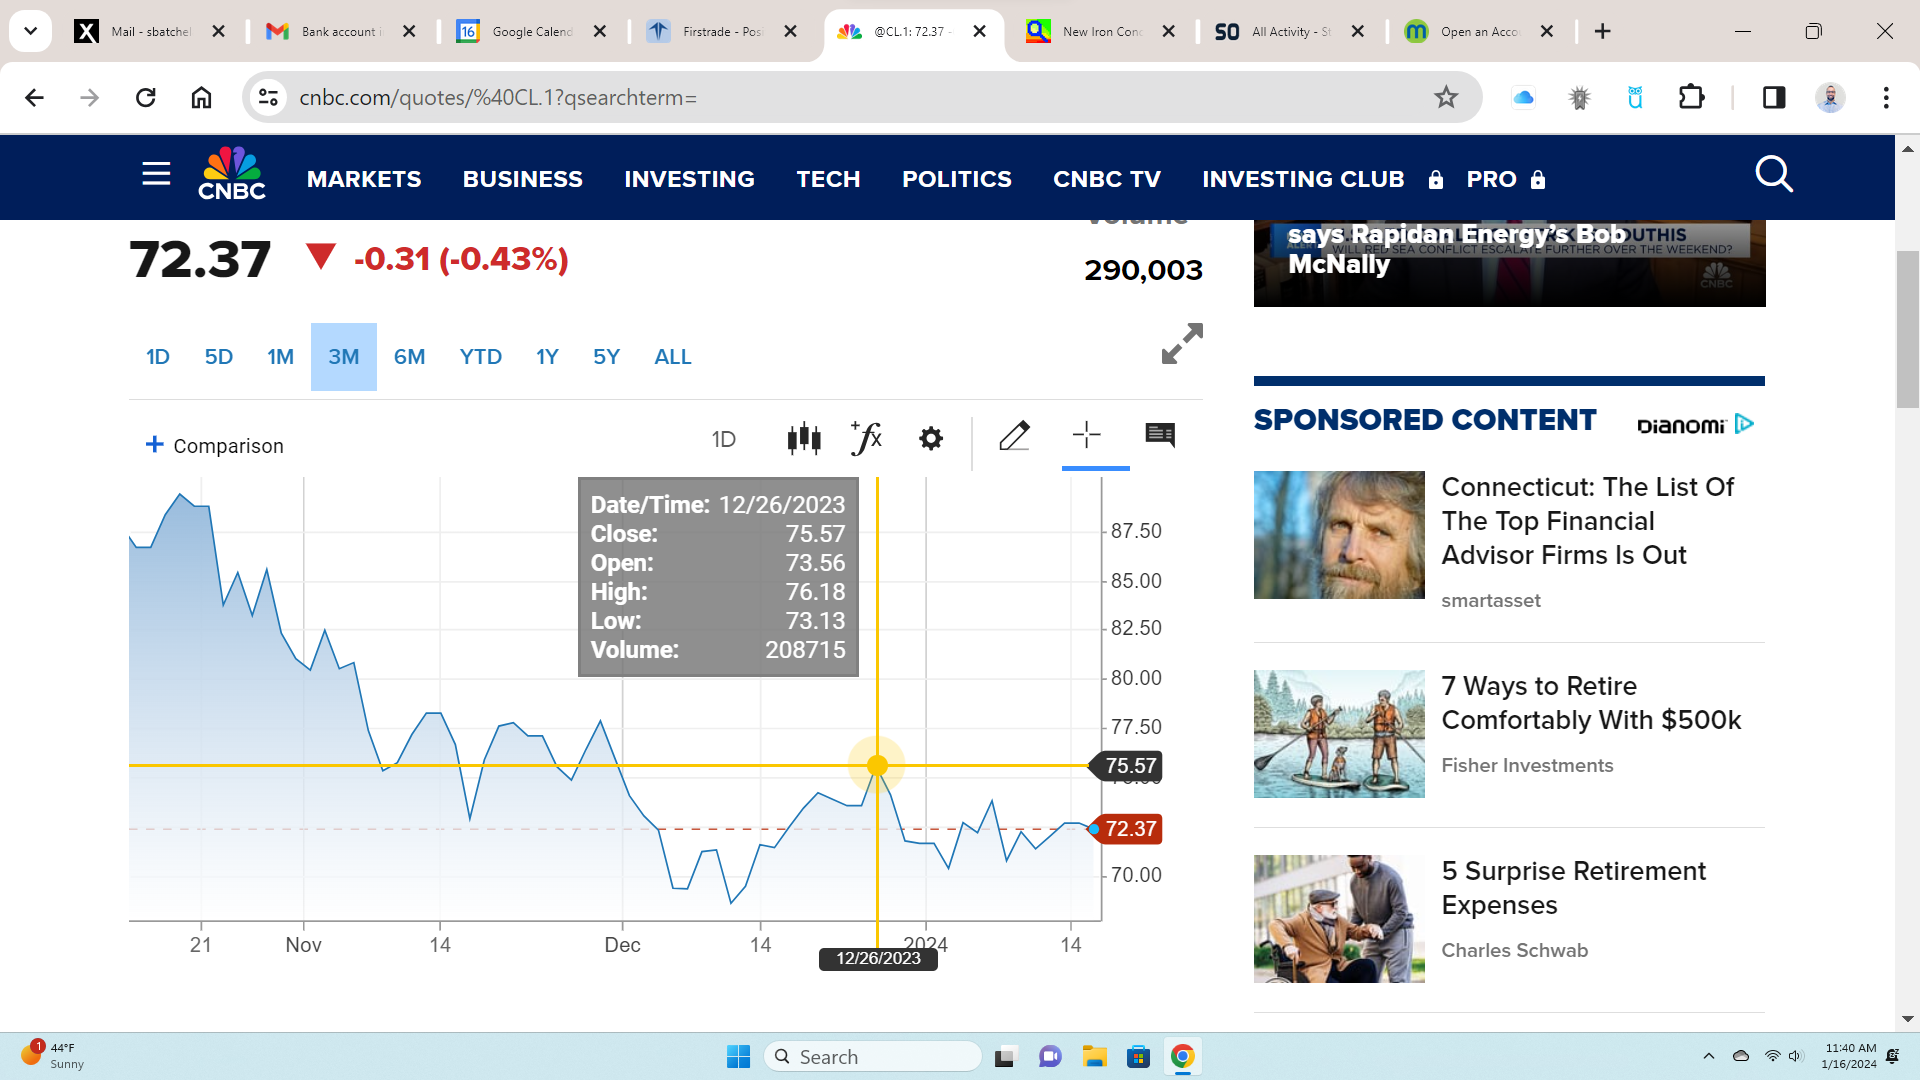
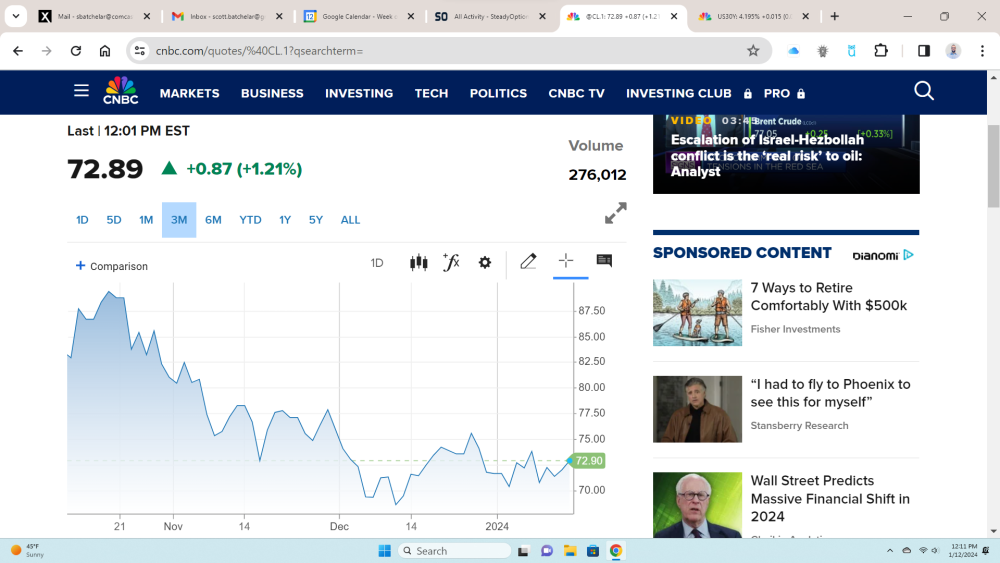
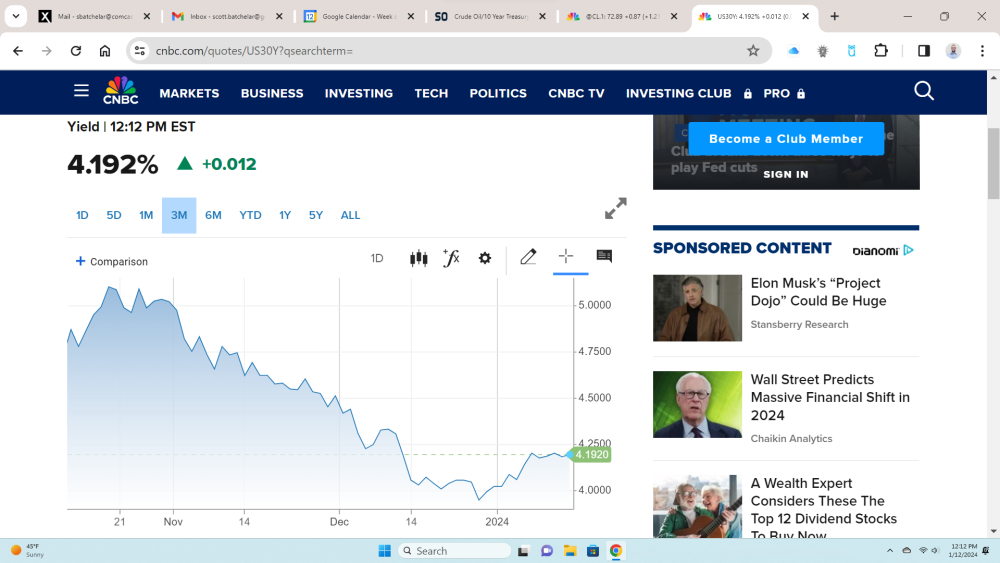
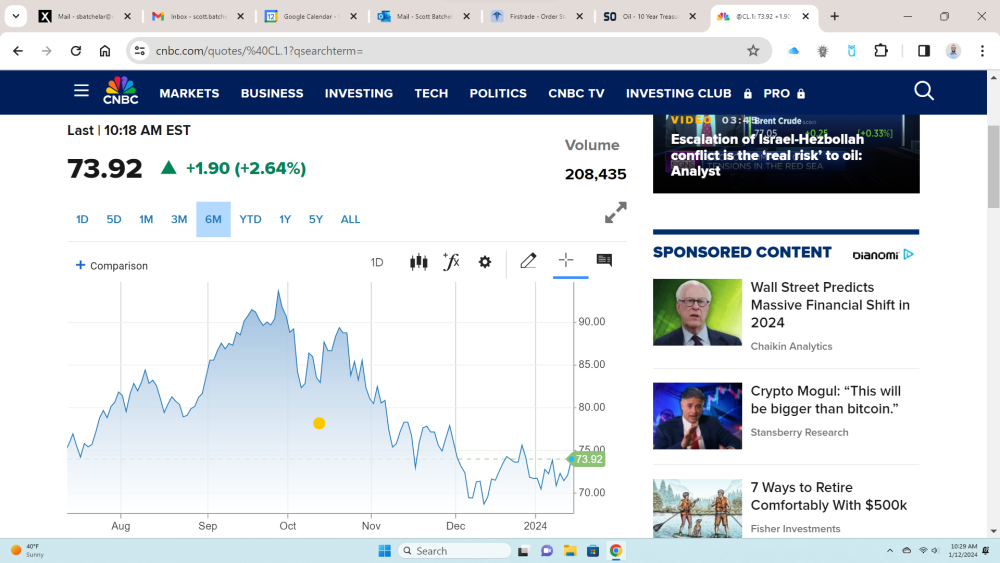
The 30 year Treasury yield usually follows the trend of crude oil with a lag of about three weeks. That has us around Christmas where crude made its most recent peak. I believe we are at or near that peak now on the 30 year treasury. Therefore we can expect the yield to drop slightly and then move sideways for a couple weeks. This would have TLT slightly higher and then sideways; perfect for the Iron Condor.


-
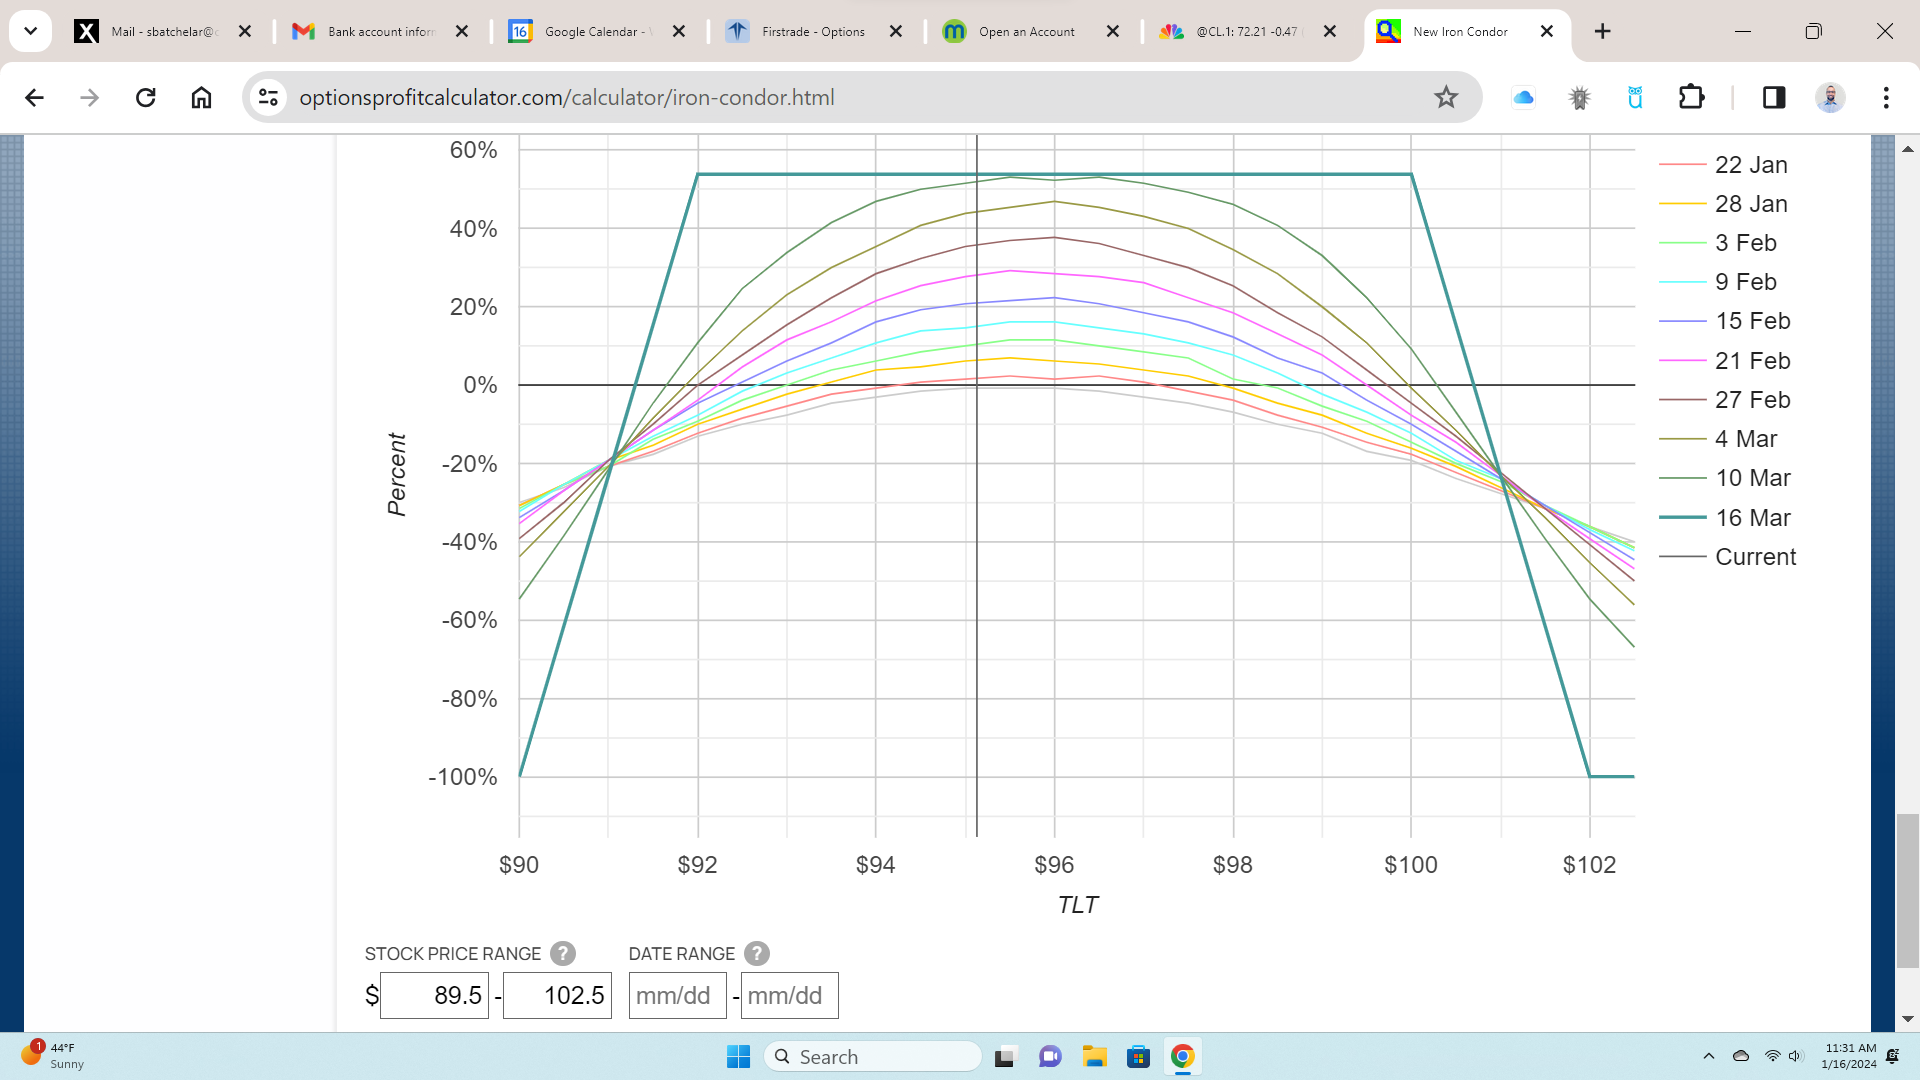
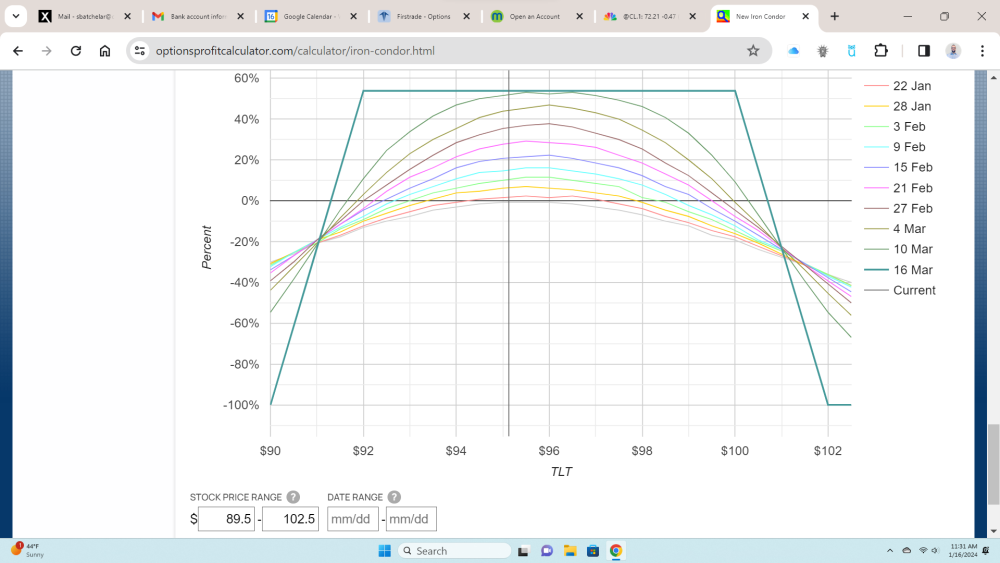
I opened the below Iron Condor: 01/16/2024 11:35:55 01/16/2024 11:35:55 01/16/2024 11:35:55 01/16/2024 11:35:55 Buy Open Sell Open Sell Open Buy Open 20 20 20 20 TLT 03/15/2024 90.00 Put TLT 03/15/2024 92.00 Put TLT 03/15/2024 100.00 Call TLT 03/15/2024 102.00 Call Net Credit 0.67 DAY Bought @ 0.49 Sold @ 0.86 Sold @ 0.75 Bought @ 0.45
-
I just closed the spread for 3.15 and the calls for .30. A quick 12% gain, I am goin to re-enter using a call spread shortly.
-
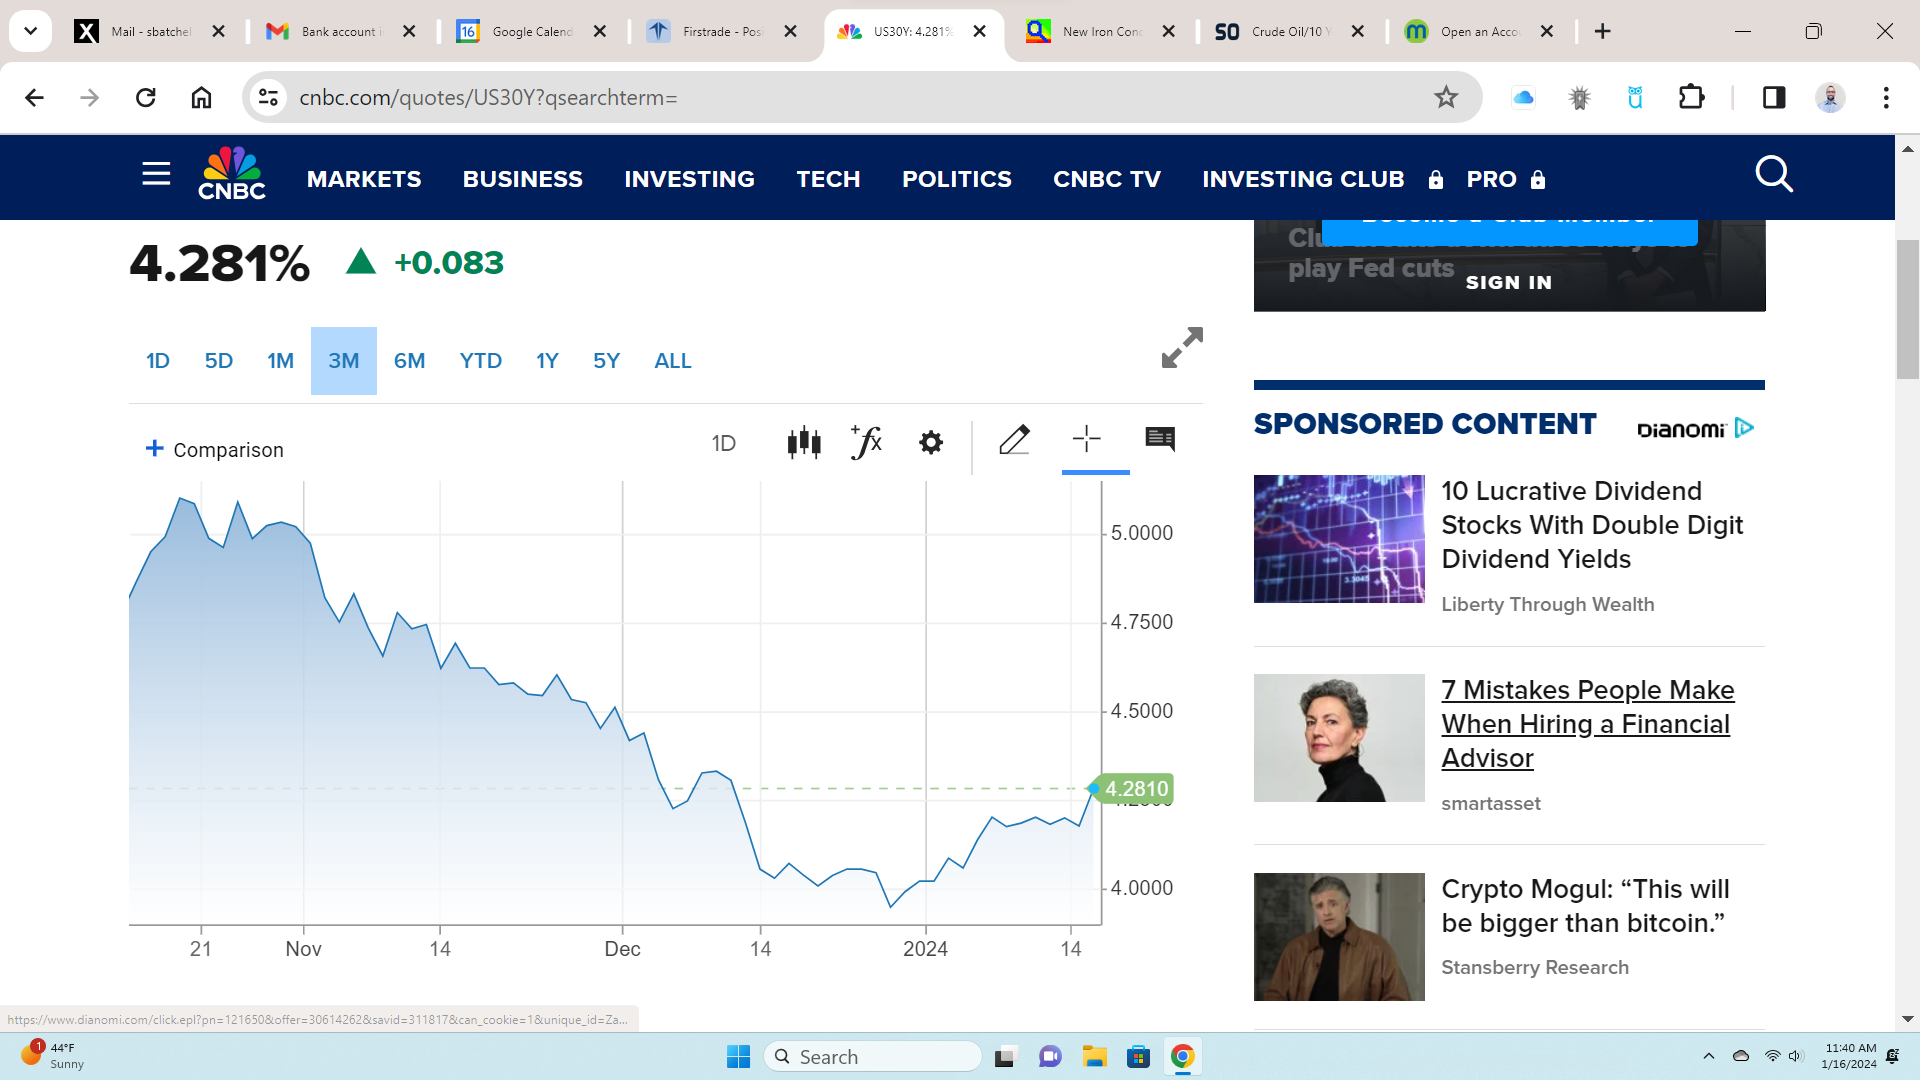
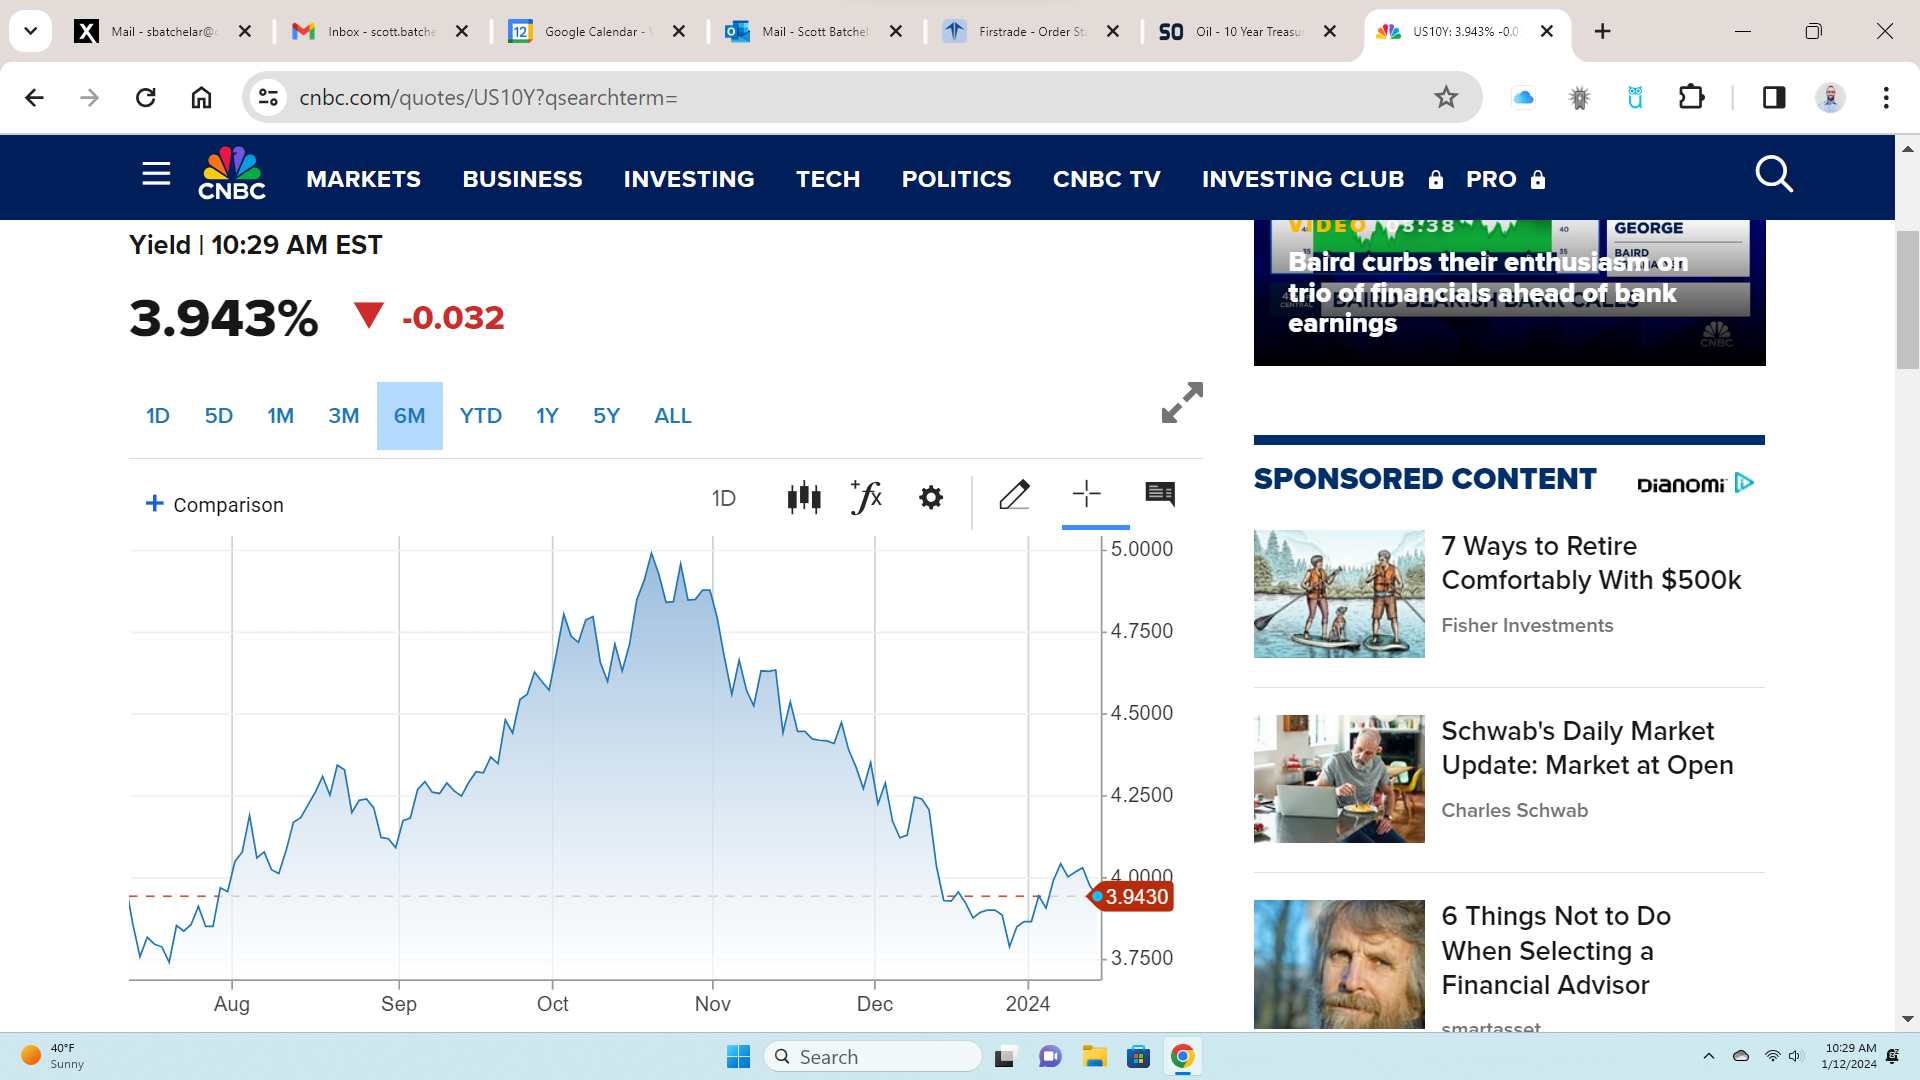
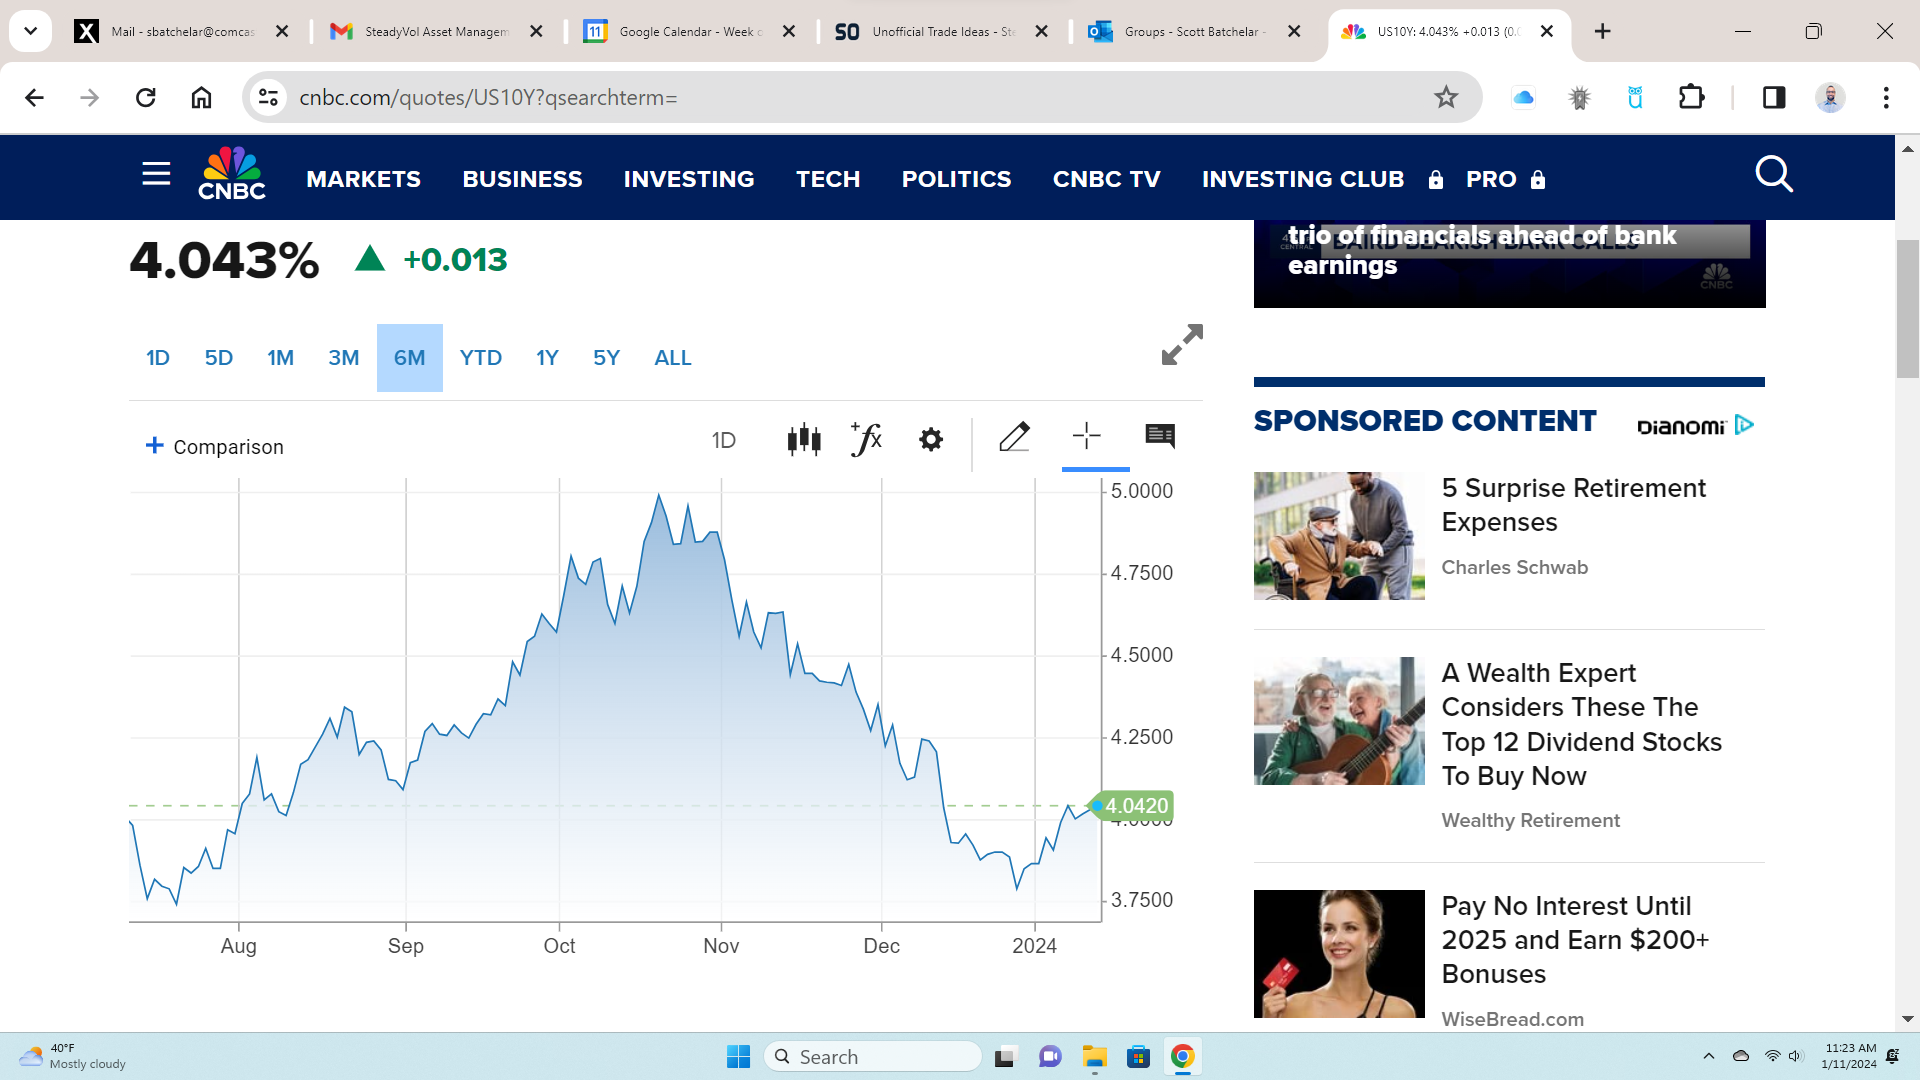
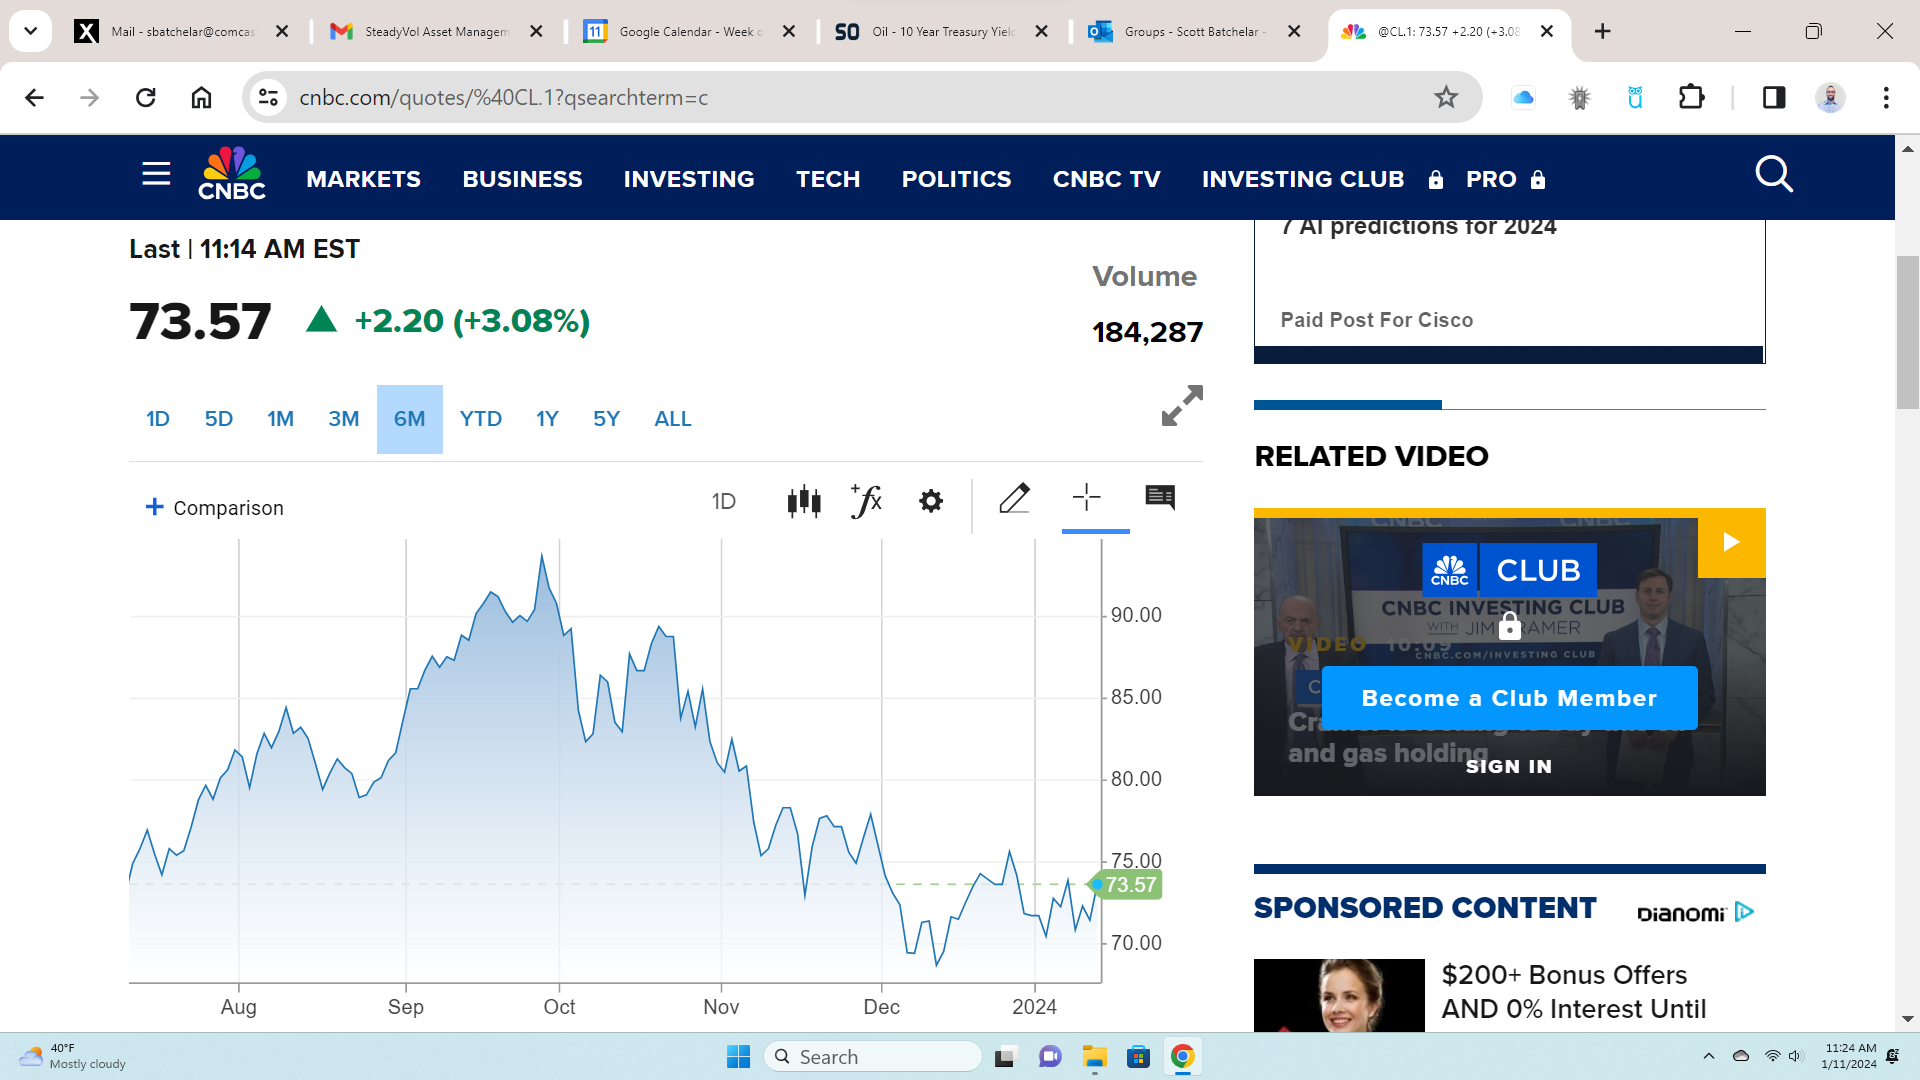
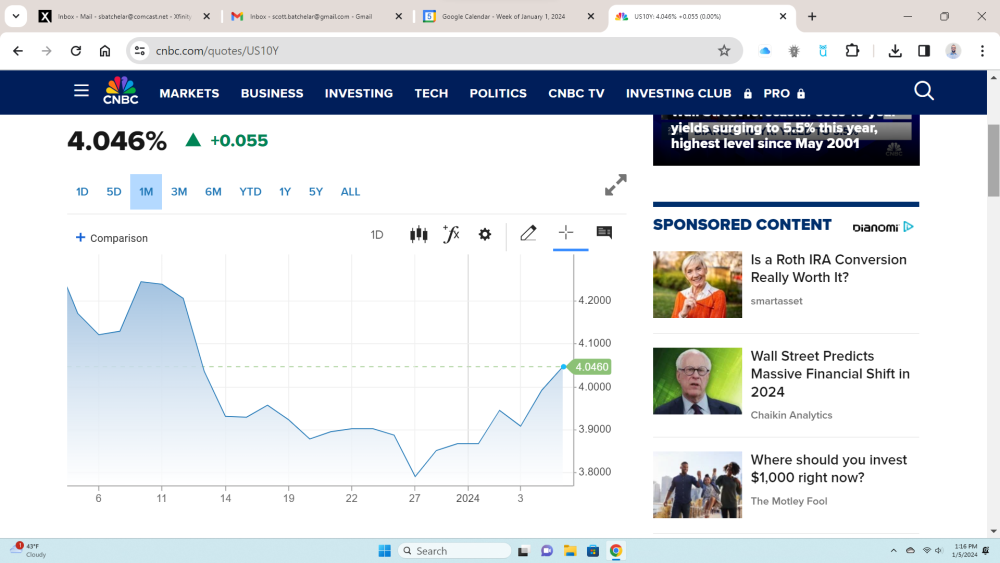
Crude: 30 Year: Looks to me that we'll get a sideways chop between 4.1% and 4.30% in the near future. If so, we should be able to exit with the move to 4.25-4.3%.
-
To more fairly represent TLT, we will watch the 30 year Treasury. Pretty much lock step with the 10 year. Crude:
-
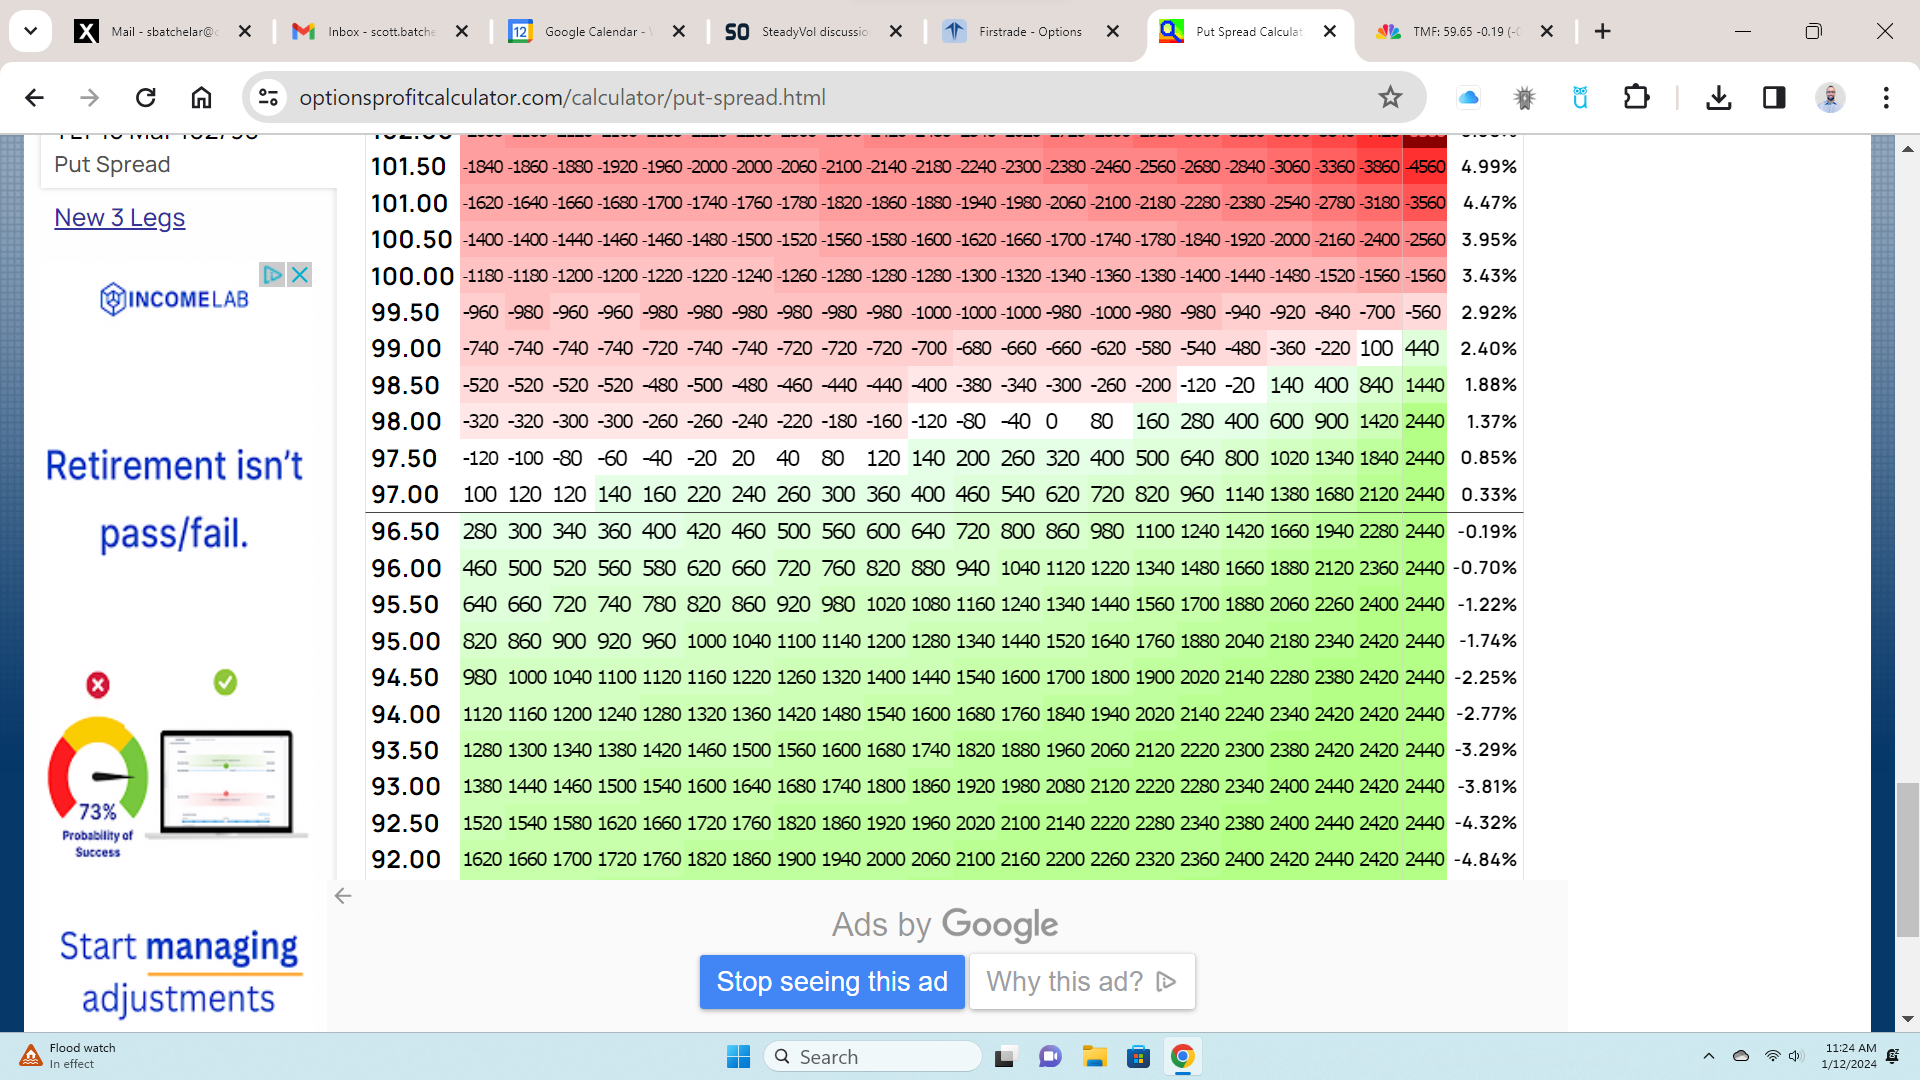
It will depend on the price action, but looking for around 30% gain. The above is just the DPS, not including the TMF calls. Worst case, we give back about $200 on those, but that would have us at around 40%, still hitting 30% net.
-
I hedged with far OTM calls on TMF in the event of a shock that has interest rates diving. This is only necessary when using the put spreads, but not when we are bullish using the call spread. 01/12/2024 11:11:45 Buy Open 5 TMF 03/01/2024 75.00 Call Limit 0.50 DAY Bought @ 0.50
-
The setup is good for more of a sideways play. I think the 10 year will move to around 3.9% before pushing back toward 4%, tracing the same pattern as oil. This would have TLT slightly lower over the next several weeks. I opened the trade below: 01/12/2024 10:34:19 01/12/2024 10:34:19 Buy Open Sell Open 20 20 TLT 03/15/2024 102.00 Put TLT 03/15/2024 98.00 Put Net Debit 2.79 DAY Bought @ 5.55 Sold @ 2.76

-
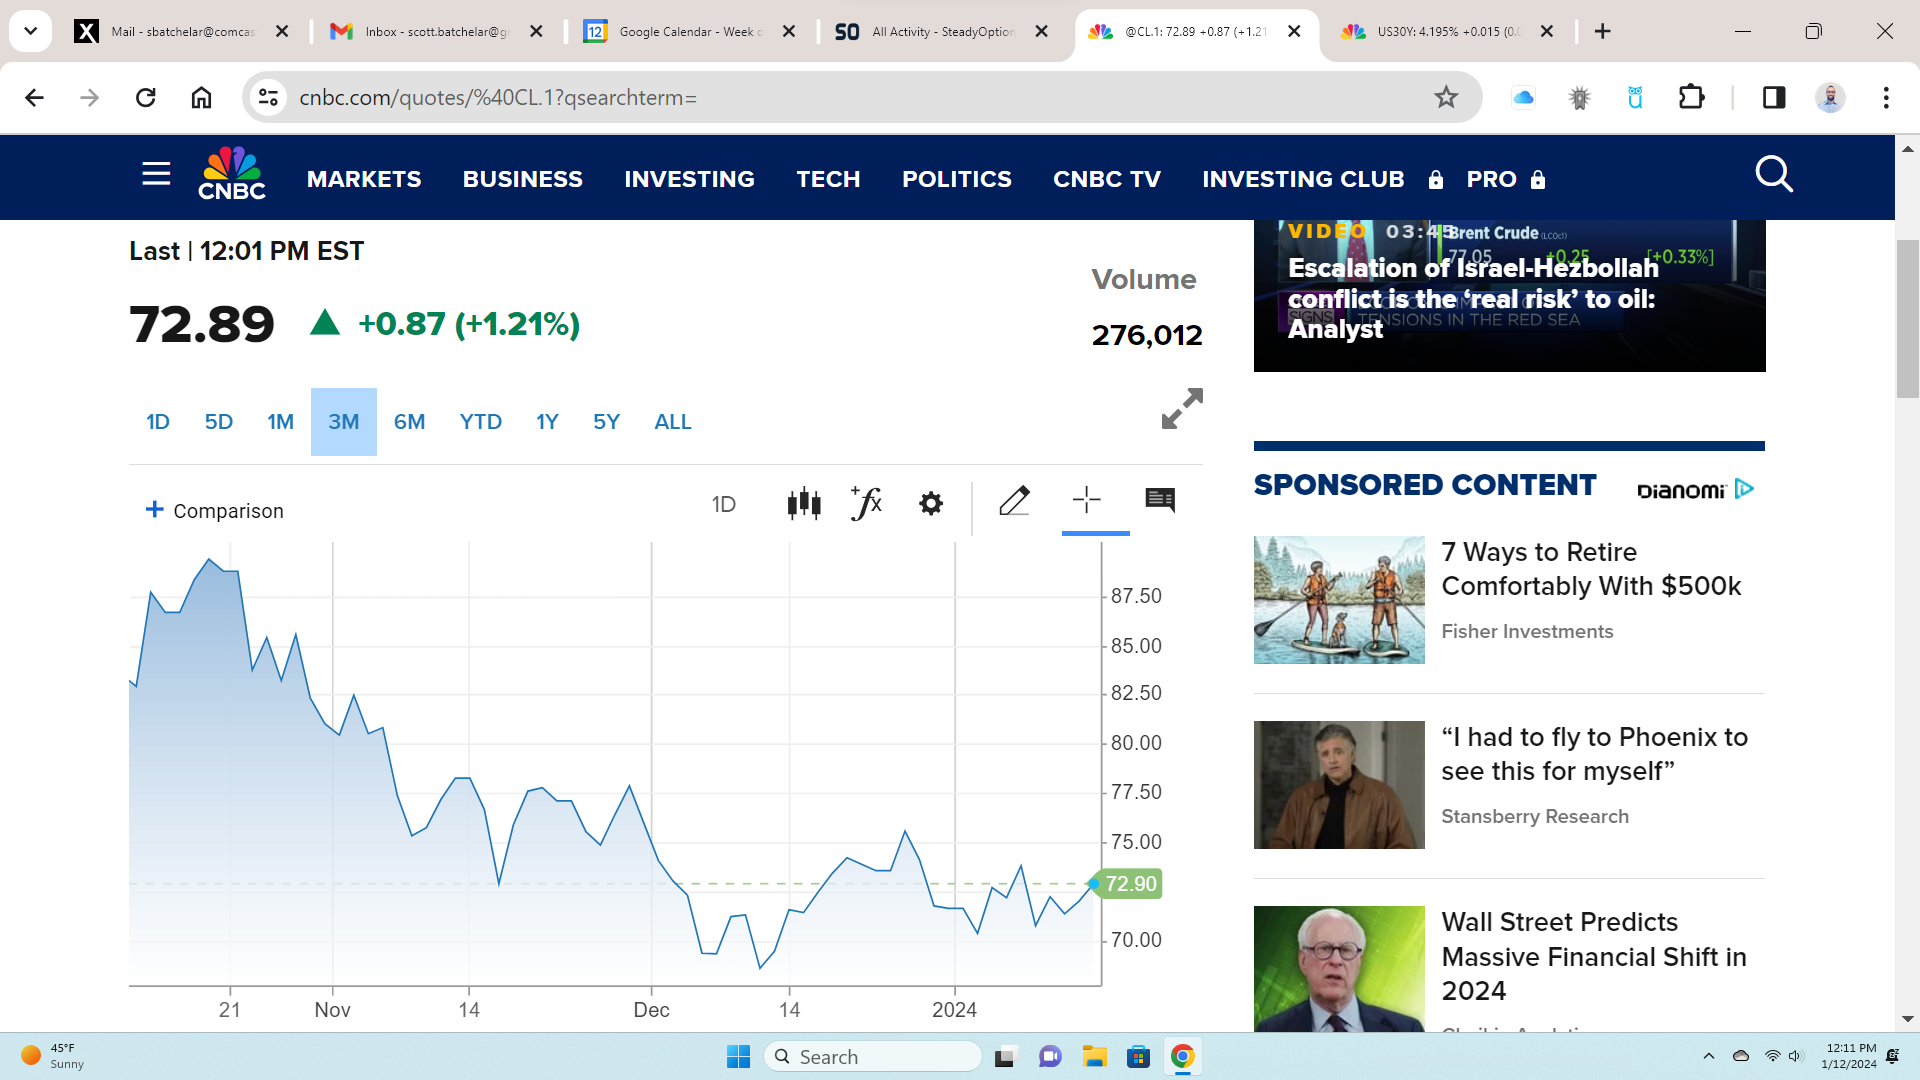
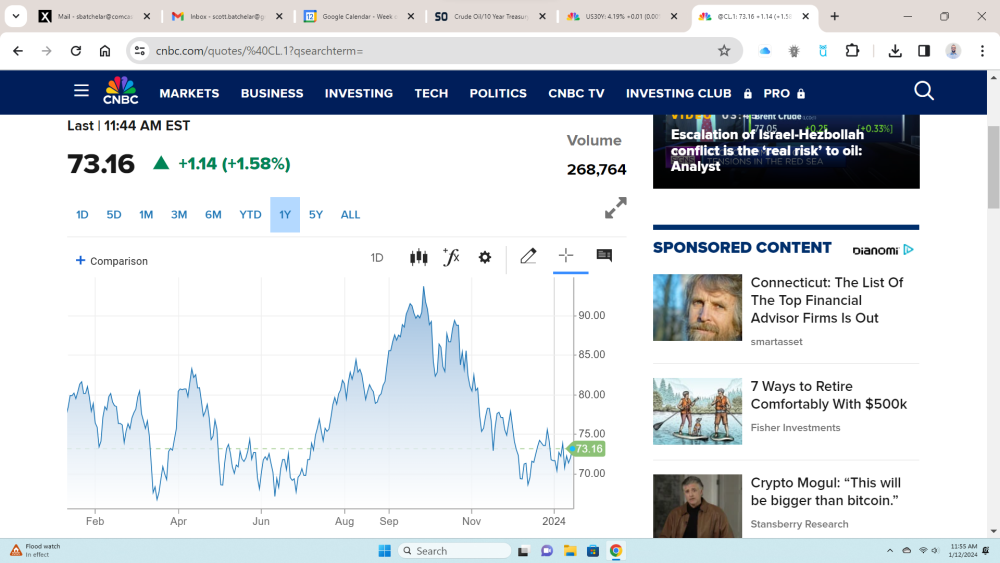
Getting interesting. This hot inflation report could fuel follow-through upward momentum on oil. It is certainly set up from a technical perspective, and now it has the fundamental. With a break of $76 on crude I would go short on TLT with a near or in the money debit put spread.


-
I just use a put or call directional debit spread (or theta positive neutral spread) on TLT/TMF after I see the move in oil but before rates start to follow. I recommended this one in October, just about 100% return. Basic idea, higher crude, lower TLT and vice versa. https://steadyoptions.com/forums/forum/topic/9288-bond-market-implosion/?do=findComment&comment=187802
-
And there's the bounce:
-
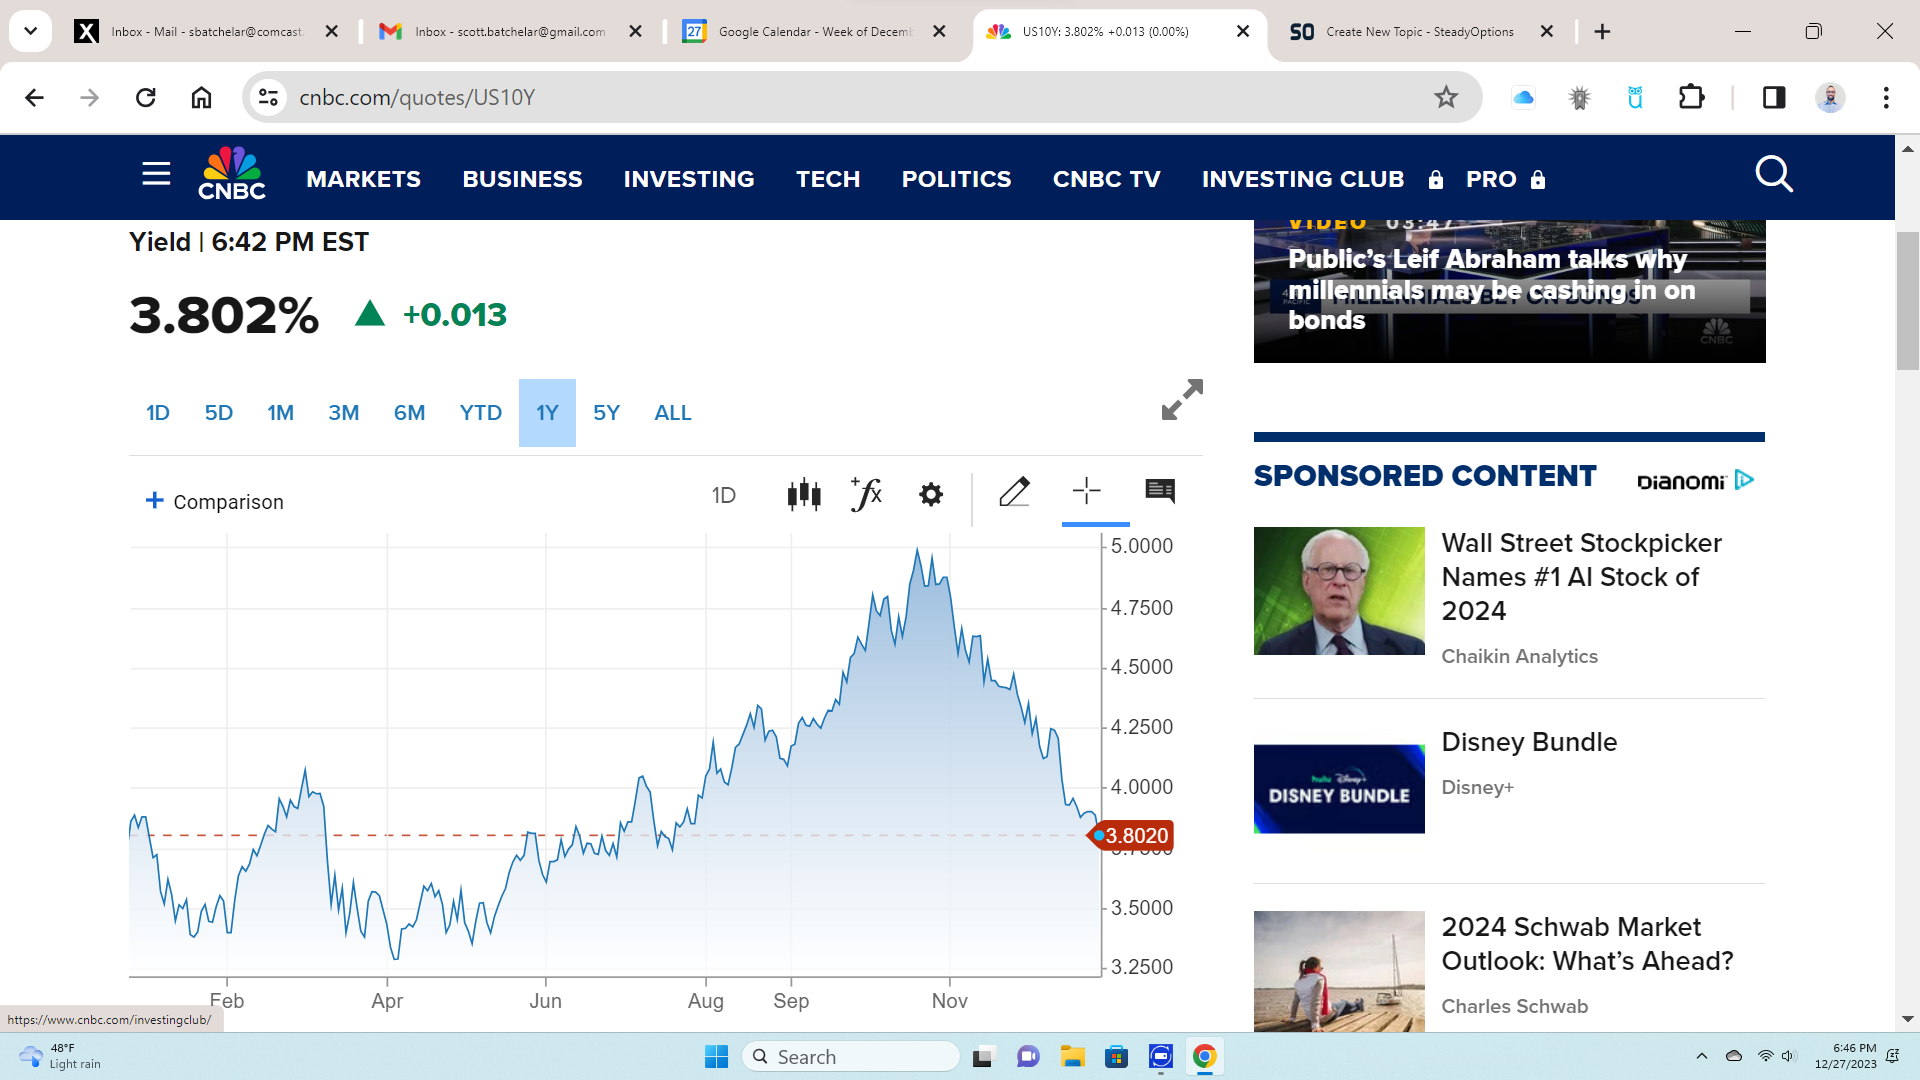
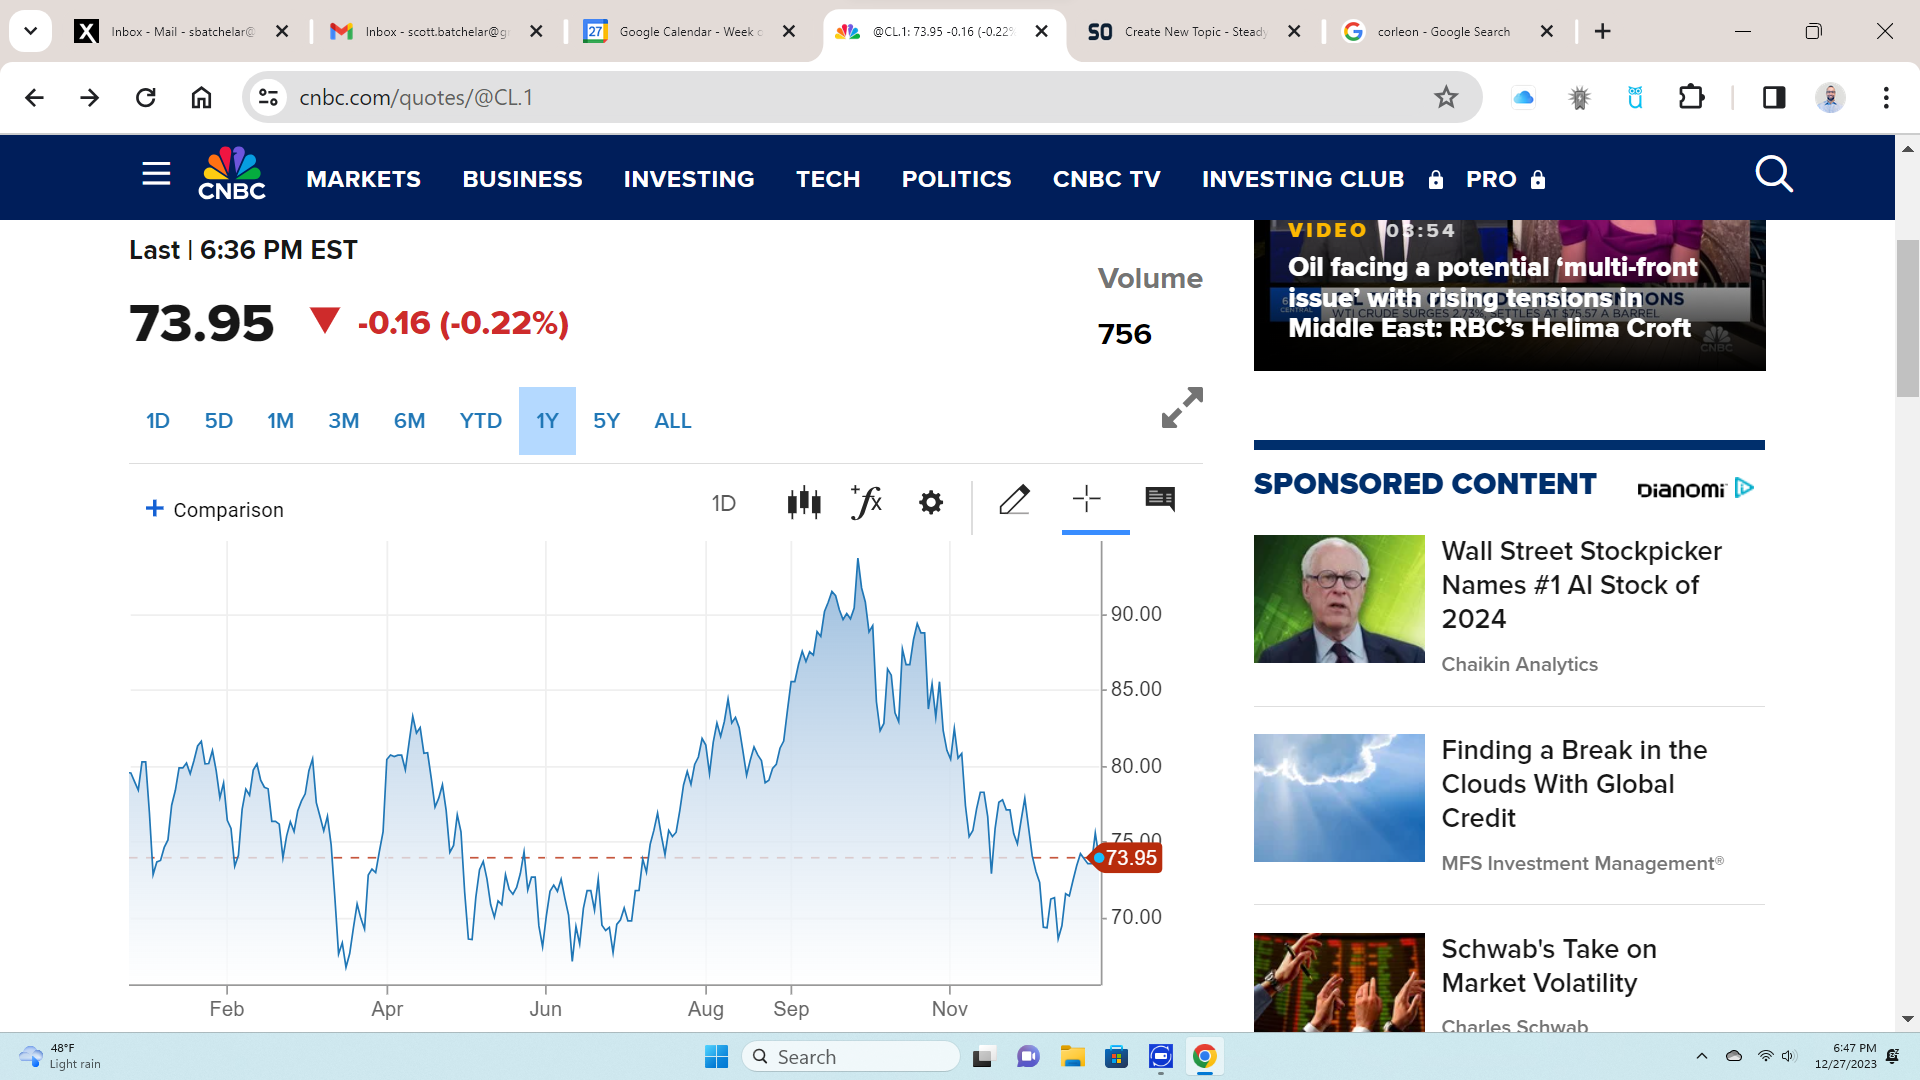
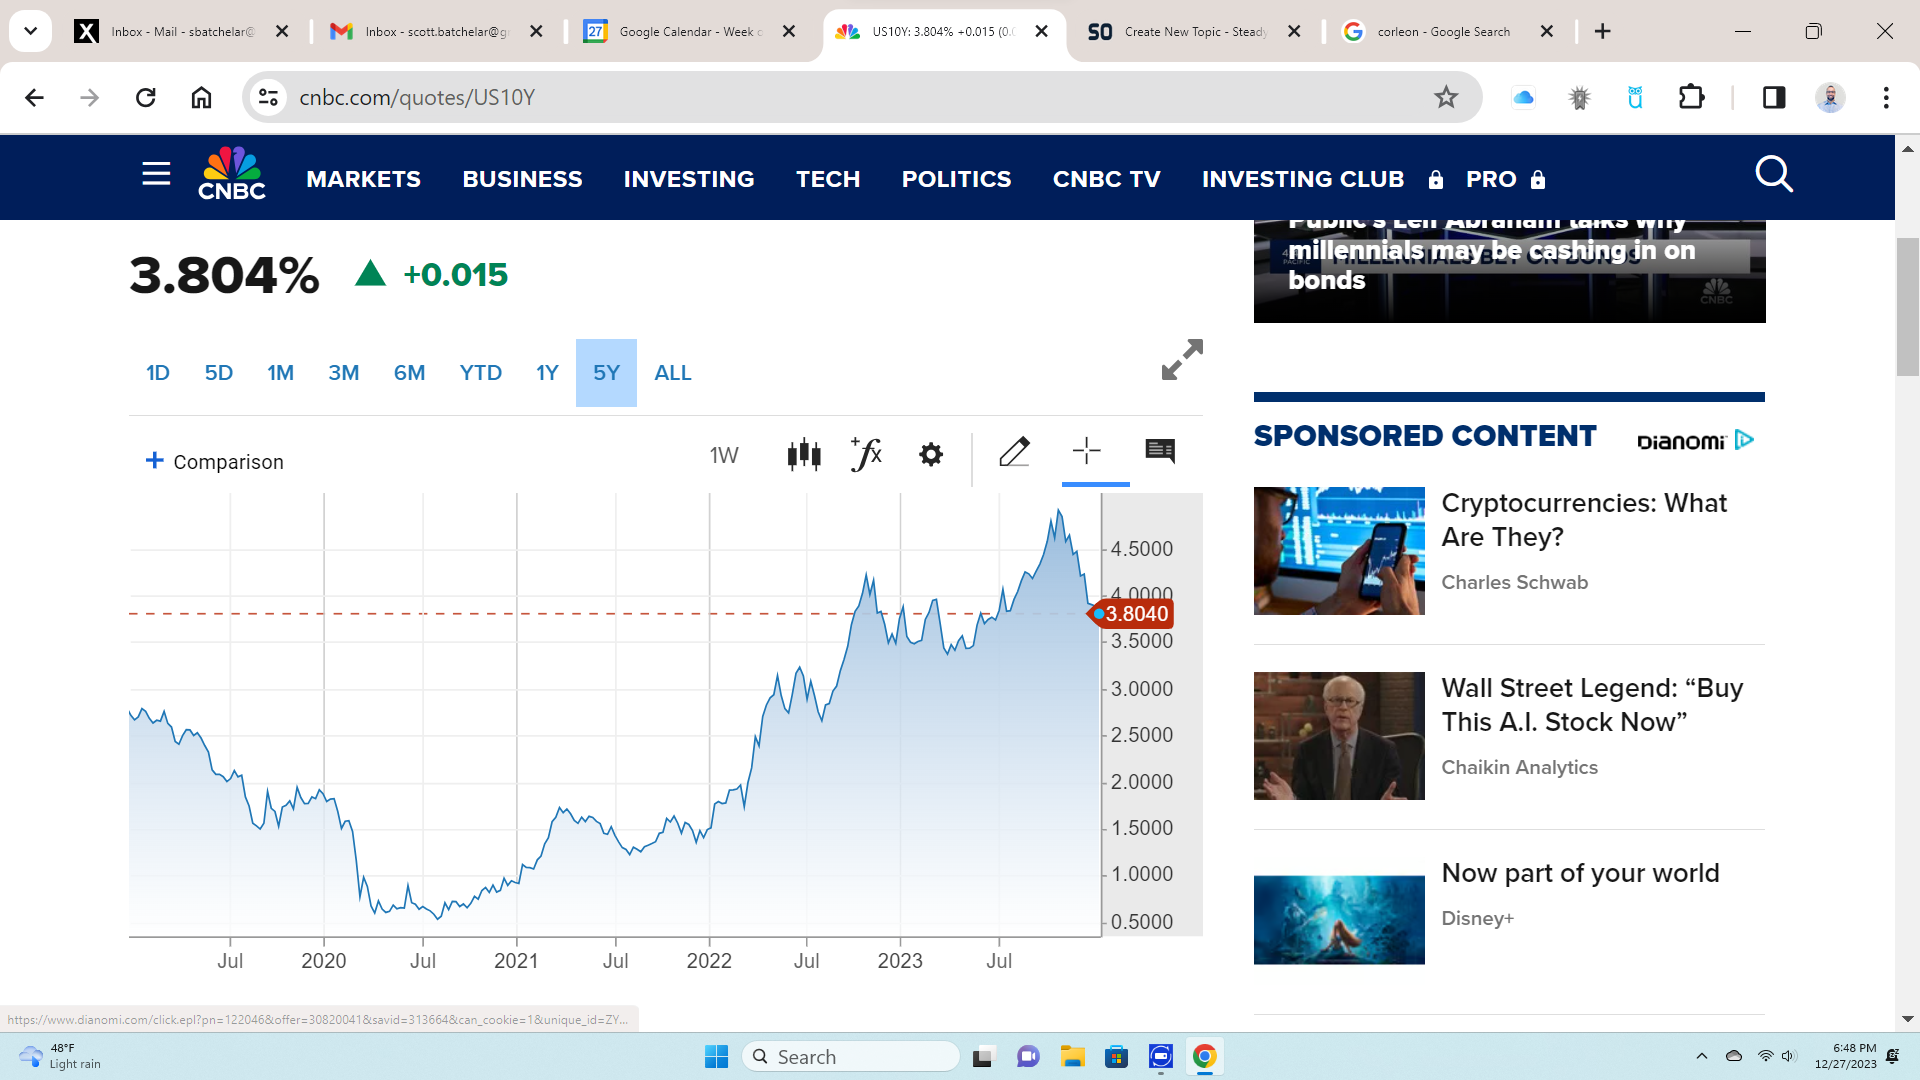
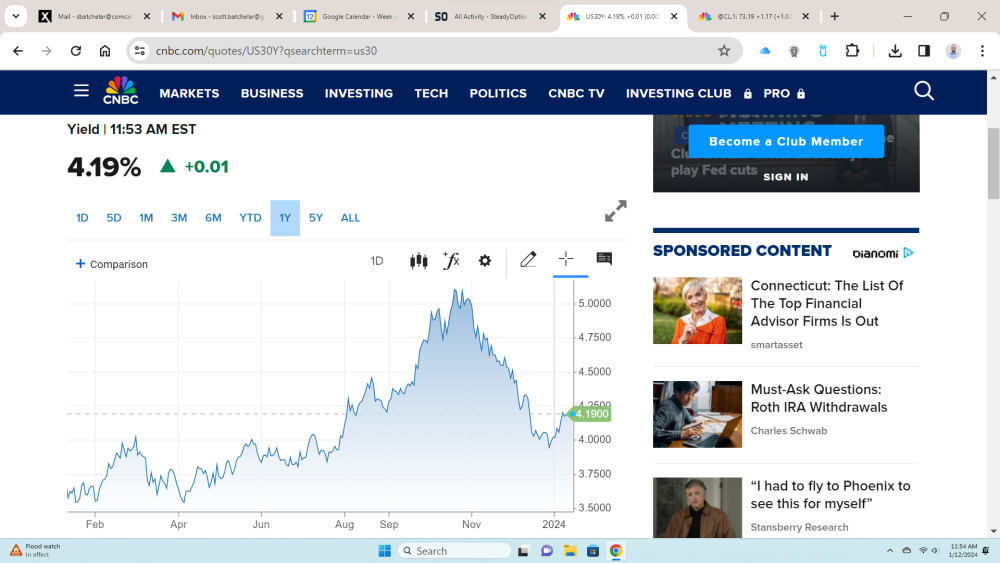
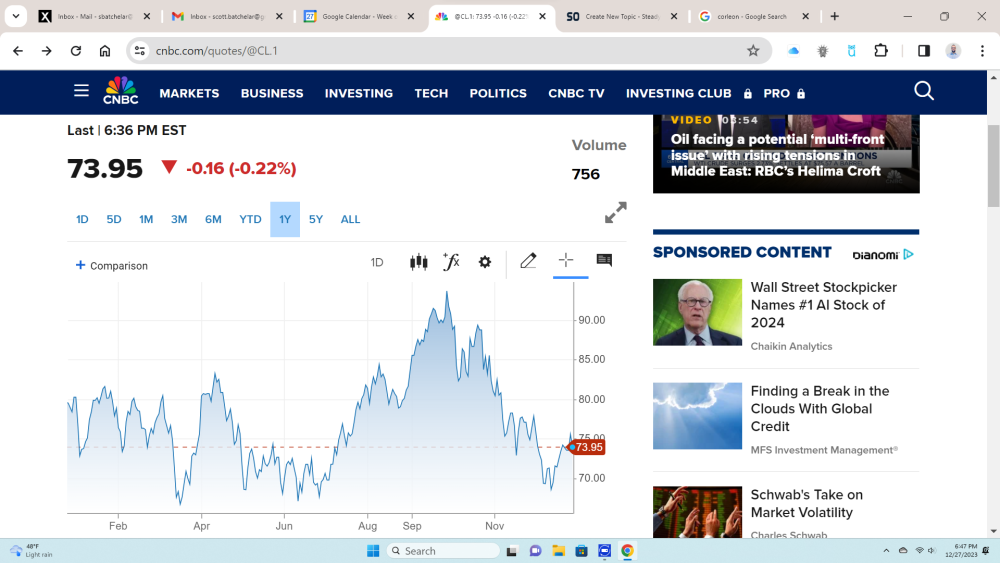
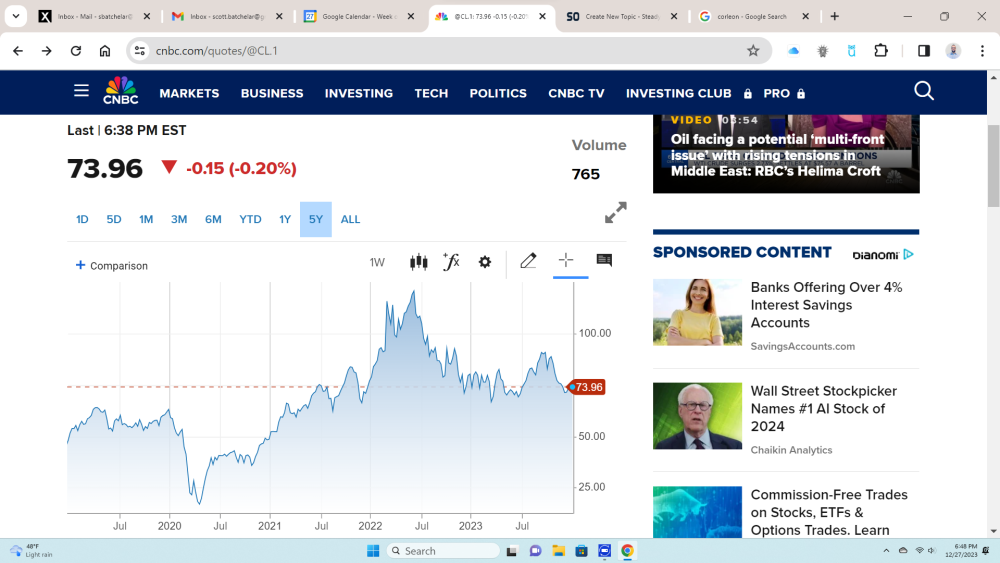
There is a definitive correlation between crude oil prices and the 10 year Treasury yield, led slightly by crude. That's the edge. The option trades around this are endless. It makes sense, higher crude price, higher inflation, higher yields. 1 year chart: Sure looks like the 10 year yield is about to move higher very soon. 5 year chart: Absolutely remarkable. Directional trades can be huge winners here. Crude leads the 10 year yield (therefore their prices are inversely correlated).

-
Here is the OCC’s PM calculator: https://www.theocc.com/Risk-Management/Portfolio-Margin-Calculator
-
IB’s algo could literally have a margin requirement of $100,000 one day and $150,000 the next in high volatility which could trigger the algo to blow the account to zero or negative and then have IB come after you for the negative balance. This is well known common practice from IB who continues to claim their algo has never been flawed.
-
The complaints are still very common with today’s version of the algo, to include a hedge fund complaining of these types of losses 2 months ago.