fradav
-
Posts
72 -
Joined
-
Last visited
-
Days Won
1
Content Type
Profiles
SteadyOptions Trading Blog
Forums
Everything posted by fradav
-
Good one Chris. Is that 15.5% profit based on cost of original longs?
-
The RICs need to cover the shorts, so need to have same expiry. They'd be too expensive 2 weeks out and would probably eliminate any gains on the calendar. But I guess there's 2 ways of looking at the trade, using calendars to hedge an RIC (for example through earnings) or vice versa, depending on what your goal is. I think it could be set up on aapl so there's a very high probability of success, I don't have the software to test it so am working out variations manually.
-
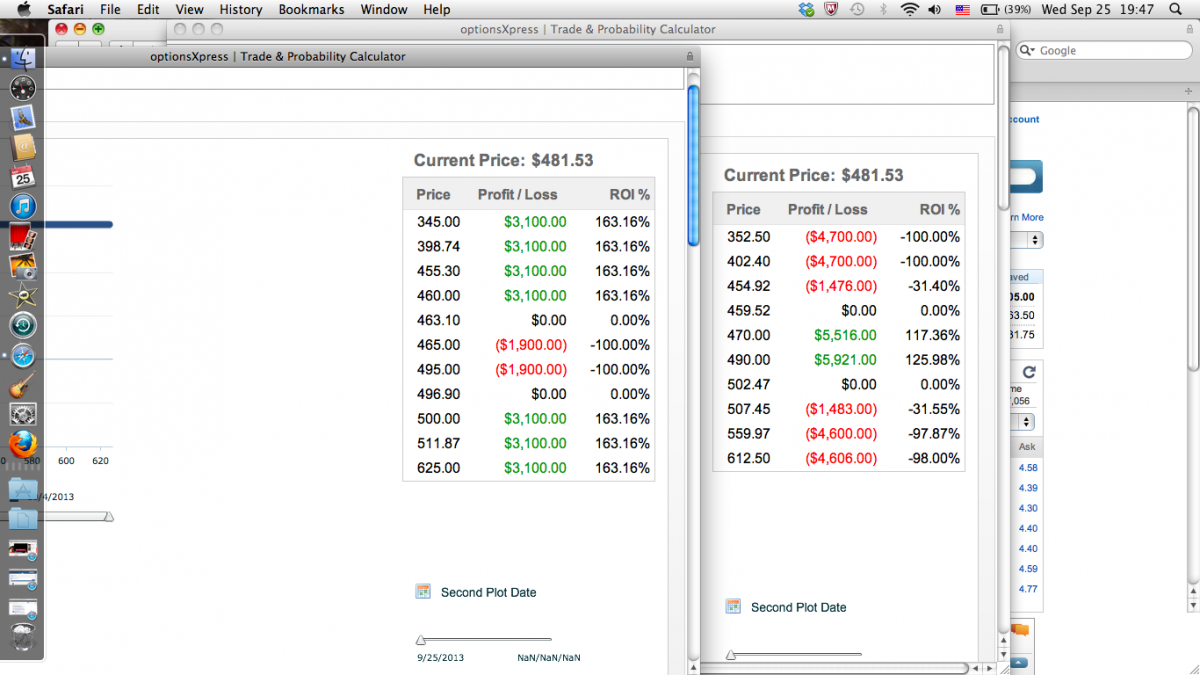
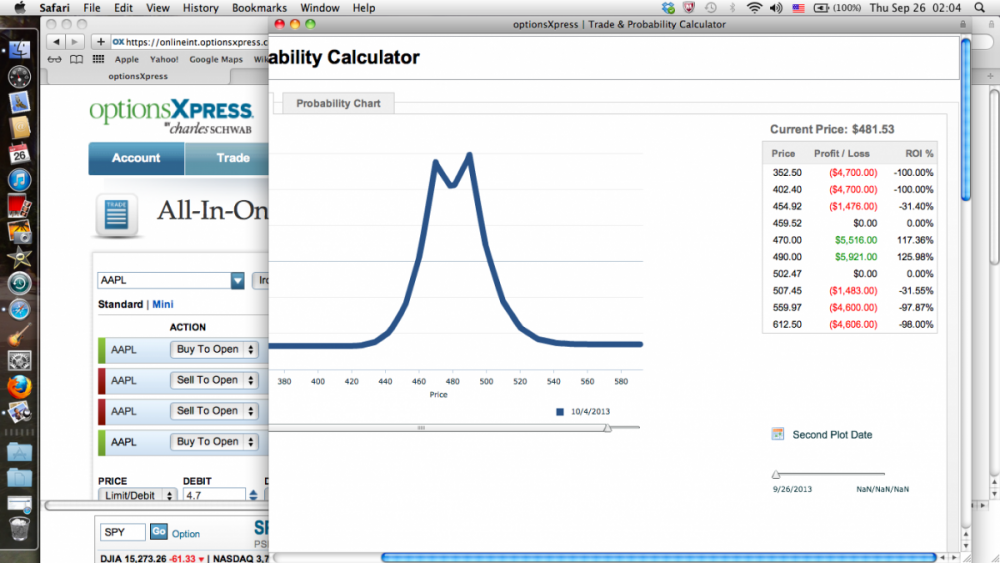
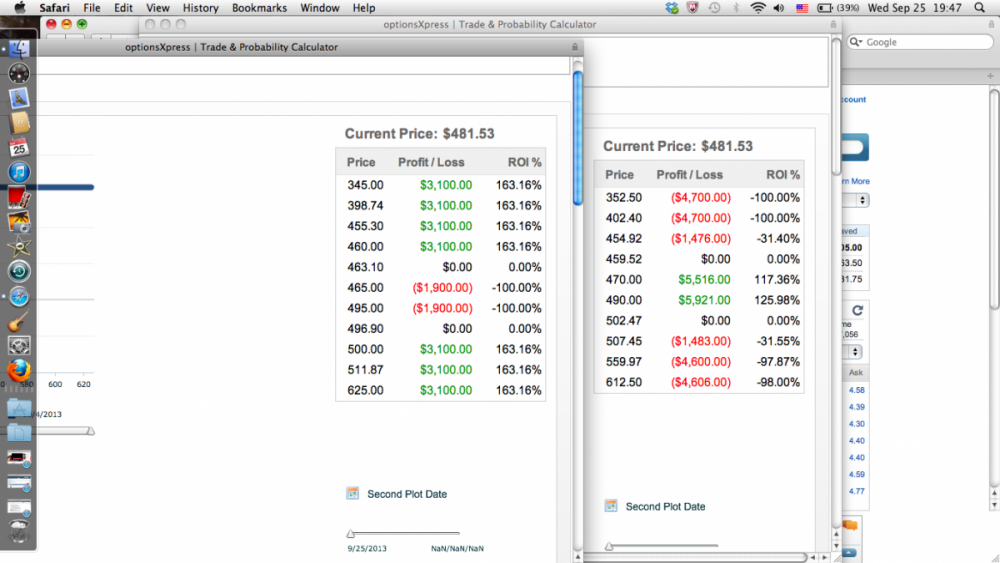
Thanks for the heads up Kim, I'm clearly being misled by my OptionsExpress trade calculator. I can see that even on a simple calendar spread it's grossly over-predicting profits. Here's how off their prediction of a 470/490 calendar is, way off. I need new software.
-
This is the P/L (RIC left, DC right) if I take the RIC shorts into 465 and 495, still with a DC 470/490 (I know you recommend closer in or a single calendar but it means the RIC has to get closer, and too expensive). There's no huge win. but it should give a few thousand dollars per 10 contracts over a fairly wide range. Will give it a run tomorrow and see how it goes. Agree, no need to touch it other than take off a few days before if profit target reached.
-
Thanks again Kim, much appreciated. I actually meant to have the IC at the same expiry as the shorts (wk 1), not the longs (wk 2). But understand it's not good around the RIC longs. I'll play around with it, only option would be taking the RIC in 5-10 points but then the profit of the calendars will of course decrease, maybe there's a sweet spot. Not sure how much the ability to hold the entire trade into expiry without adjustments helps, I'll find out.
-
Thanks for feedback Kim. Bizarre, your calculator gives a very different result from mine. Without using software, we can calculate that the 455/450 IC is worth $4200 at 450 (5000 minus the 800 paid), and when the calendars only cost $4700, I can't work out how your software has a 50% loss at 450. The max draw down on calendar profits is $800 which may be compensated for by ability to stay in trade until expiration. Anyway, I'll paper trade it and see how it goes.
-
...one more point, by my calculations it works best on weeklies, first because you need a narrow probability range of for the calendar, but also because you need a very cheap OTM hedge, otherwise it kills profits on the calendars. The gamma risk associated with weeklies is eliminated by the OTM RIC hedge so you can sit and wait until expiry for max theta burn on the shorts
-
For example if I was entering it today on aapl I'd place a double calendar Oct wk2/Oct wk1 470 for the puts and 490 for the calls, 10 contracts, cost $4700 I'd hedge it with 2 Oct wk 2 debit spreads (buying the strike closer to the stock price), 455/450 puts and 505/510 calls, 10 contracts, cost $800 The breakevens of the calendars are 459 and 502. The breakevens of the RICs are 505 and 454. The max loss on the calendar is total paid, 4700, and the ICs payout 4200 if it's over 510 or under 450. So hard to lose (again if my calc is right, seems too good to be true). When I say '85%' I just mean 85% chance of being out of the money, around .15 delta if you prefer.
-
I've tried it (paper) with RUT, SPX and AAPL and get best results with AAPL, 85% OTM 5 point RIC costs about 40 to 50c per spread with 10 days to expiry and are highly liquid. More importantly, I get a wider profit zone with the AAPL calendars, either single or double, which I assume is due to the fact the premium/IV is more in relation to stock price as compared to SPX and RUT. The indexes are more narrow or leave a steep dip in middle of tent with a double. As you say you can still lose if there's a very large move but it looks like there would be a high probability of profits most weeks (if my trade calc works). But there's normally a catch.
-
H Kim, when trading the weekly calendars, would it not be a good hedge to place OTM RICs (vertical credit spreads) on the calendar breakeven points? I know it's hard with RUT with 10 point increments and low liquidity, but on a stock like aapl the far OTM options are so cheap you can almost elminate upside and downside risk if you set the trade up properly, albeit at the expense of some profits should the calendar work as intended. It doesn't work on monthlies, the zone between the 90% probability calls and puts needs to be narrow, as it is for weeklies. The only caveat is this works on my options express trade calculator and I've found out it can't be trusted for P/L on calendars.
-
Good analysis and discussion. Kim, that you discuss this trade on a forum open to general public, and thereby draw attention to it, and also are capable of admitting that mistake were made, sets your service apart from at least 95% of other services (and traders) out there. Almost nobody talks about their losing trades.
-
Chris, I meant that the delta values for the 1 week versus 2 week expiry almost mirrored one another within a range, not that there was only a .5 to .8 difference for corresponding options with different expiry dates. But ok, if it gives you better downside protection I understand (although I would have thought this would even out when SPY goes up again since closer to expiry with higher delta lose value quicker. But the system clearly works, one week or 2
-
Hi Chris, regarding rolling a week earlier than expiry, with the delta's of ITM puts from 173-180 almost identical between puts that expire tomorrow and in a week or 2 (from about .5 to .8 respectively), wouldn't it make more sense to leave until expiry or close to expiry to maximise extrinsic unless they're very DITM? Or is it protection against a crash? Or does it allow us to get further ITM whilst getting the needed instrinsic to protect longs in a strong move up? Thanks!
-
Ok, thanks for rapid reply Kim.
-
Hi Kim, I'm in the RUT IC. As a hedge against a post FOMC rally I'm thinking of initiating a SPY put diagonal trade similar to what Chris trades, buying Dec 14 170 puts and selling Sep wk4 173s in a 20\15 ratio. If there's a rally it's a good hedge and if the opposite happens the IC goes back in the profit zone and the SPY losses are only temporary (if I recover enough extrinsic over time). VIX isn't that high so Dec puts are not that expensive and could be ok time to enter trade. Any thoughts?
-
Regarding bids showing on SPX, I just noticed that this is only the case if you put in a single trade, e.g., a call or a put, but is not the case for a multi-leg trade, such as a spread (for obvious reasons), so that's a simple explanation for the difference we observed.
-
Great analysis of various outcomes Kim. Since you normally don't stay in these position until expiration, wouldn't a put with a shorter expiration (e.g. at date of planned exit) give you a better return with respect to cost and gamma?
-
Kim, my bids/orders do show on the screen with SPX. The system whereby you only place a single order in (Mikael's link) is a good idea but is commission heavy ($9.95 minimum per trade for me) so it would cost the same for me to sell 5 SPX puts that way versus 50 SPYs.I guess it would work with other brokers if there was no minimum.
-
Ok thanks. I've traded ICs on it before and got bid\ask on the more liquid quarter strikes (25/50/75/00) but struggled with the 10's. I was just thinking as it's typically less volatile than the RUT you must have a reason for choosing the latter for your calendar spreads.
-
Kim, I notice you don't trade SPX at all, is it because you prefer to avoid being stuck in a pit-traded index if it moves against you?
-
To put some meat on the bones of my comment that I think it's a very impressive performance, I've gone though some comparisons of how I'd have fared with $10,000 in capital at the start of SO inception, i.e, July 2011, by making various common investment choices (please add a comment if there's another comparison you can add). Please note these are very approximate and don't include dividends/commissions (which skews results in SO's favor). However, the differences are so striking these factors won't have any major impact on the take home message. If I'd put it into SPY ETF: Taking profits off table at end of each year- 2011---(6 months) 10,000 --10,200 ($200) 2012---10,000-12,000 ($2000) 2013---10,000-12,000 ($2000) Compounding 2011-2013---10,000-14,200 ($4200) Total profit $4200 If I'd invested in popular common stock 10,000-12,000 AAPL (total profit $2,000) 10,000-15,000 GOOG (total profit $5,000) 10,000-50,000 TSLA (total profit $40,000 minus $250 for crystal ball so $39,750 ) If I'd followed a commercial delta .1 Iron Condor service (e.g. MCTO) 2011-10,000-9900 (-$100 loss) 2012-10,000-15,000 ($5000 profit) 2013-10,000-12,500 ($2500 profit) Total profit $7400 If I'd followed Steady Options Taking profits off table at end of each year:- 2011-10,000-32,000 ($22,000) 2012-10,000-24,000 ($14,000) 2013-10,000-17,000 ($7,000) Total profit $43,000 (less with commissions!) If I had the time I'd also like to display occasional monthly drawdowns on each of the above, which would put SO losses into perspective (risk management is excellent). The diversity also provides a much better protection against a crash than most of the above. There are weaknesses of course, >$100k accounts, whether trading style is compatible with full-time job, timing of entry, etc, but all in all it's hard to argue with the above numbers. For the sake of transparency, I've still to place a single trade advised here, been a member for 2-3 months and have been simply observing and learning (have been actively trading but following my own ideas). But as anyone who's been trading for any length of time will know, it's hard to beat the market no matter how clever you try to be. If I'd looked at SO's returns a few years ago I'd have thought "Not bad but I can beat that". But I haven't and I now look at them with much more respect. Any criticisms/flaws in my logic welcomed.
-
Good job Kim, that's an impressive performance record over time, with and without commissions
-
Thanks for that Kim. My trade calcs don't take in the drop in volatility so no. Would it be better choosing a back month closer to Julywk4 where there's a greater drop in IV but less debit, like Aug monthly? Or less drop in IV but more debit (like Jan)? I'd be planning on closing out the position on Friday if the calendar spread is in the profit range.
-
Anyone any thoughts on the following AAPL earnings trade. It's basically an ATM calendar hedging a weekly far OTM strangle adapted for holding through an earnings report (1) Buy 10 x Oct 425 calls for approx 20 k debit (another back month may be more optimal) (2) Sell 10 x Jul weekly 425 calls for 10k credit (3) Using 18% of credit received from short calls, buy 5 x weekly 400/450 strangle. The strangle is positioned both on the edge of the profit curve for the calendar, which is alos of course around the outer strike at which options pricing are predicting for a post-earnings move. Outcomes: If the reponse to earnings is flat the calendar earns and covers loss on strangle. If the response is extreme, the strangle covers loss to both upside and downside on calendar. Important points/caveats: The stangle should ideally be sold as soon as possible post-earnings when wildest swing occurs, unless game-changing info is announced that will drag stock way beyond what option pricing is predicting (i.e., > $20 move) There's also some 'weak' spots where there is break-even points and potential losses. Would need to spend time trying to tweak strikes to minimise them It does require some guessing as to when to close the positions, and is best suited to either a big move post earnings (good for strangle) followed by a return to the norm (good for calendar) or a flat response with no swing. The worst is a flat response in first few days (strangle loses) followed by a big movement, eg 425 Wed and Thu then jump to 450 Friday. There are of course a huge amount of variations on this play using puts instead of calls and strike prices. I realise every possible trade combo has been tried out long ago, including this, but according to my trade calc this trade stands a pretty decent chance of success. Any thoughts/catches much appreciated. N.B. It's likely that there will be a loss on the strangle, it's more insurance. However, every once in a while it could be a home run, something I've experienced from the wrong side of the trade.
-
Hal, am not expert but 1 and 2 are out, longs puts get crushed. As Chris mentioned earlier this trade is best in neutral/downward market (or slowly rising). Doing it with calls would work (but for me too risky as I believe it's easier for market to fall down than up) So if I was very bullish I'd just sell an ATM put credit spread with small allocation or the above trade (option 3) with calls. Of course I could buy naked calls if I was uber bullish but been burnt too often doing that.