
Leaderboard



Popular Content
Showing content with the highest reputation on 11/05/26 in Posts
-
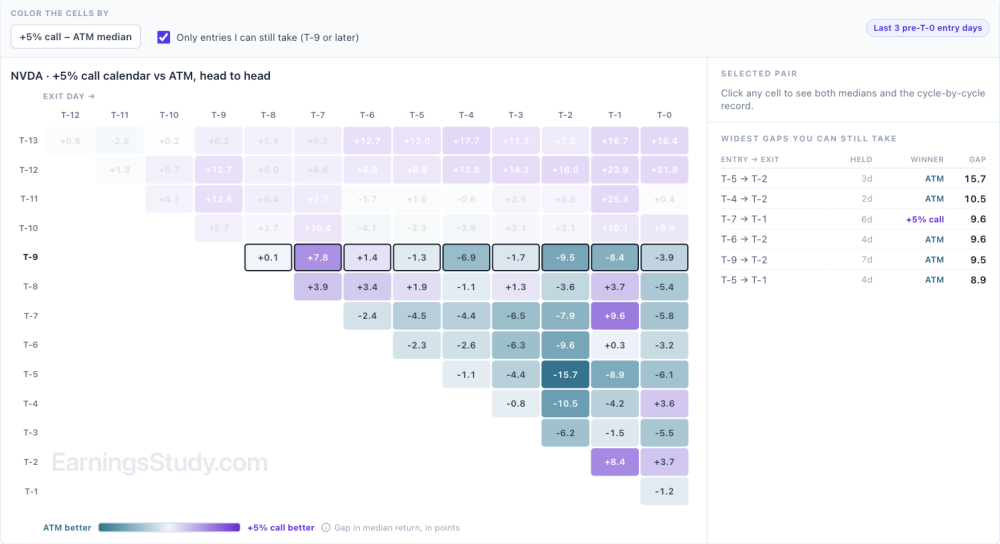
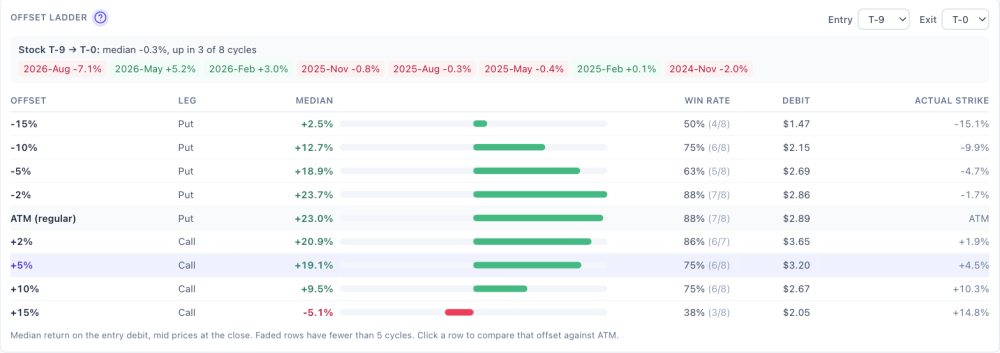
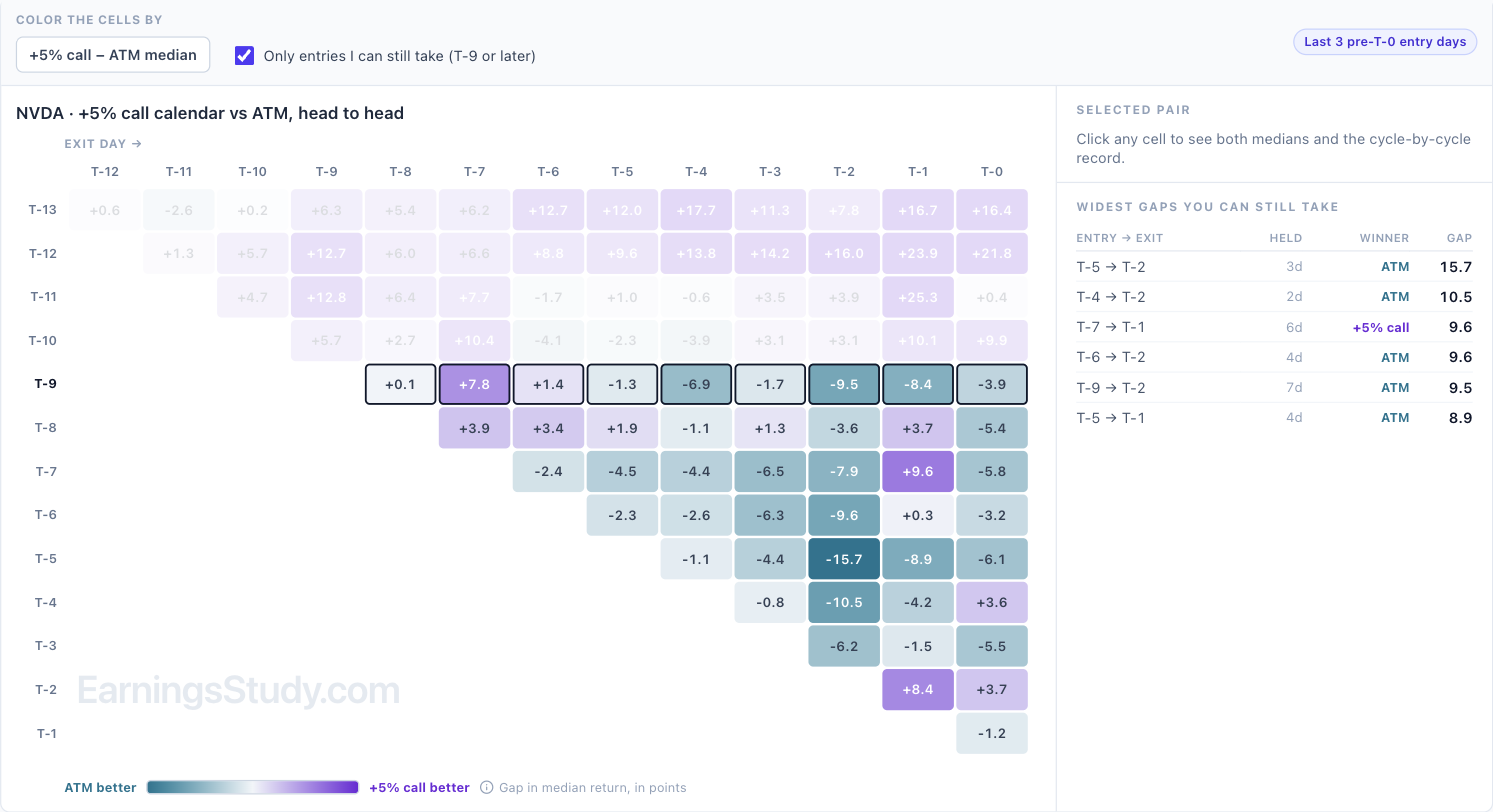
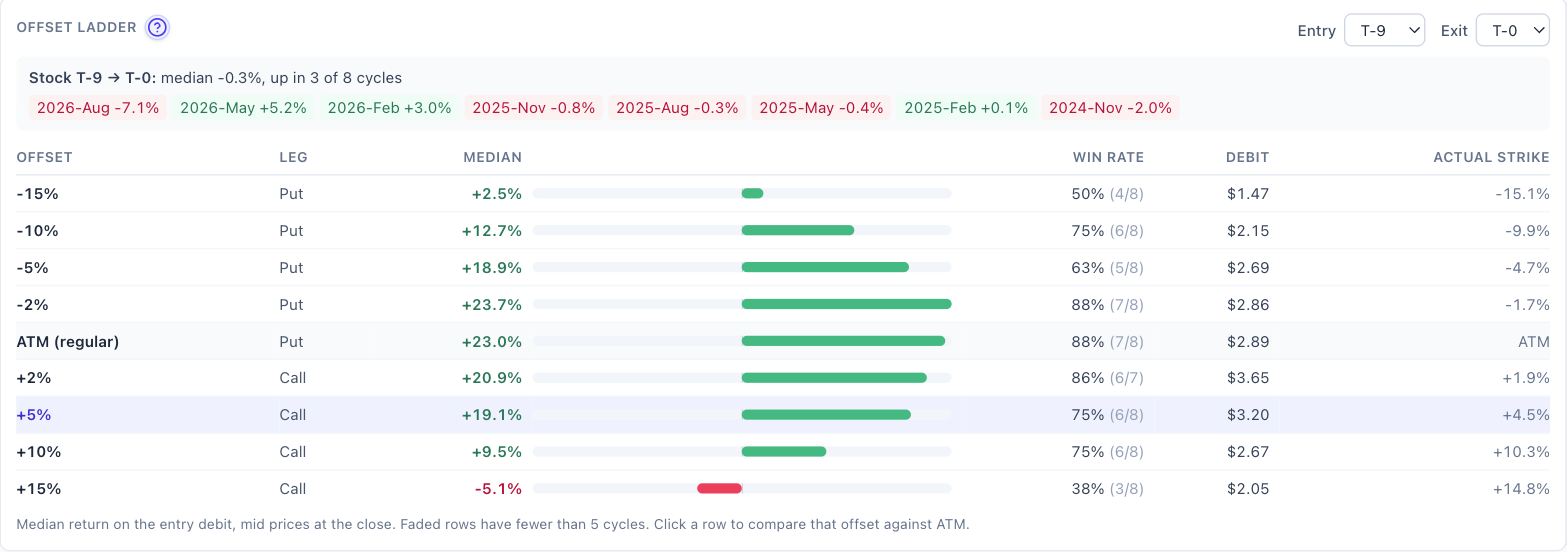
Coming soon: Directional Calendar The Calendar page models the at-the-money calendar. Plenty of calendars around earnings are placed off the money instead: above the stock if you lean bullish, below it if you lean bearish, or wherever you think the stock will sit by the report. The next addition to the Calendar page models those, and it's in testing now. Here's a preview on NVDA, which reports Nov 17 after the close. Numbers are from EOD data through Nov 3, at T-9. What it models. A calendar with the strike set 2%, 5%, 10% or 15% above or below the stock. By default, strikes above use calls and strikes below use puts (the out-of-the-money side), and you can switch either one to puts or calls. It isn't a separate page: in the Calendar page's History Matrix, choose Directional from the Compare with menu, and the regular calendar stays on screen next to it. The strike rule. A strike only counts if it actually lands near the offset you picked. For +5%, that means between 3.5% and 7.5% above the stock. If no listed strike fits, that day is skipped rather than quietly rounded to the money. At +5% on NVDA, all 115 entry days priced, the strikes landed a median 4.9% above the stock, and the calendar cost a median 1.98% of the stock price. Compare with Directional, +5% call calendar, NVDA. 1. Head to head with the regular calendar. One grid: each cell is the directional calendar's median return minus the ATM calendar's, purple where the offset did better and teal where ATM did. For NVDA's +5% call calendar entered at today's T-9, the offset only came out ahead on short holds (7.8 points better exiting at T-7). From T-5 onward the ATM calendar won every exit: by 9.5 points at T-2 and 3.9 points held to T-0. The widest gaps still available mostly go to ATM, led by T-5 to T-2 at 15.7 points. +5% call calendar vs ATM, gap in median return (points). Today's T-9 row is outlined. 2. Offset ladder. For one entry and exit, every offset next to the regular calendar and the stock's own move. NVDA from T-9 to T-0: the stock moved a median −0.3% and rose in only 3 of 8 cycles. The ATM calendar returned +23.0%, the −2% put +23.7% and the +2% call +20.9%. At ±5% returns were about 19%. Further out they fell off: −10% put +12.7%, +10% call +9.5%, −15% put +2.5%, and +15% call −5.1% with only 3 of 8 cycles positive. Offset ladder, entry T-9, exit T-0. How to read it. NVDA has barely moved between T-9 and its reports, so strikes near the money did best, and the further out the strike, the worse the result. A directional calendar pays when the stock actually travels toward the strike before you exit. Check the stock drift line and its cycle-by-cycle chips before reaching for an offset. On NVDA they range from −7.1% last August to +5.2% in May, with most cycles inside ±2%. Two cautions. These are 7 or 8 cycles per cell, so treat any one number as a sample, not a rule. And strikes far from the money cost less in dollars (the −15% put was $1.47 against $2.89 for ATM), so their percentage returns swing harder. I'll post here when it opens. If you place calendars off the money a particular way (other offsets, a fixed dollar distance, a different expiration pair), send it through the Ask button while the design is still easy to change. Educational research only, not trade advice. Based on EOD data; past cycles don't guarantee future results.

 1 point

This leaderboard is set to New York/GMT-05:00