
Leaderboard


Popular Content
Showing content with the highest reputation on 11/03/26 in Posts
-
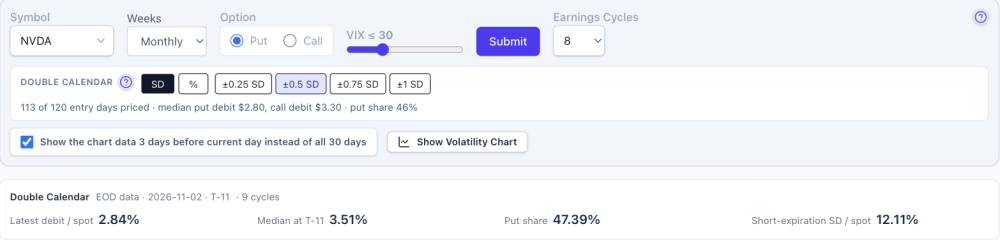
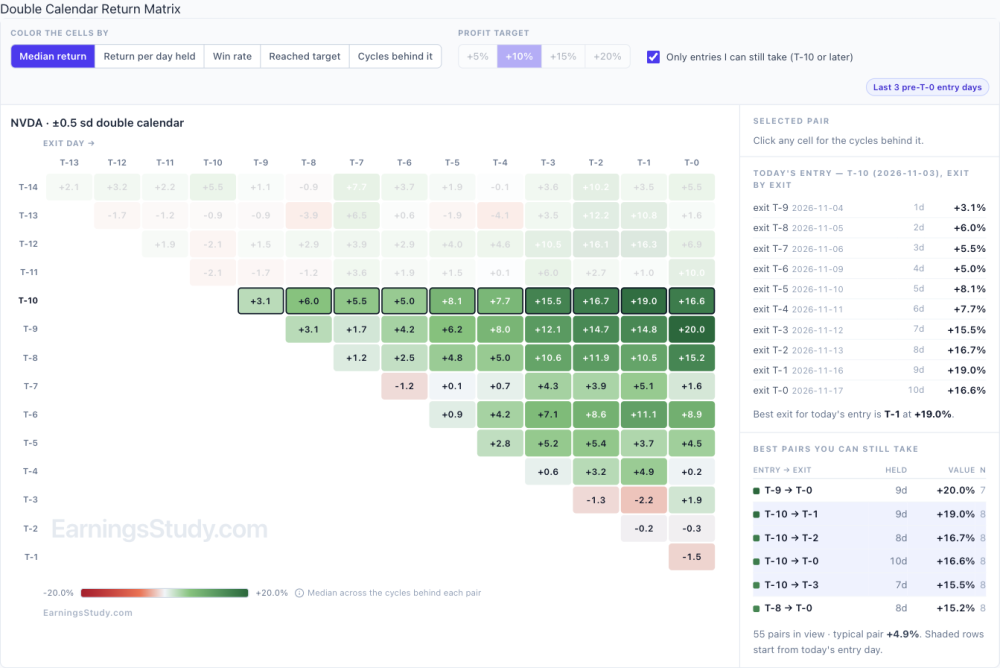
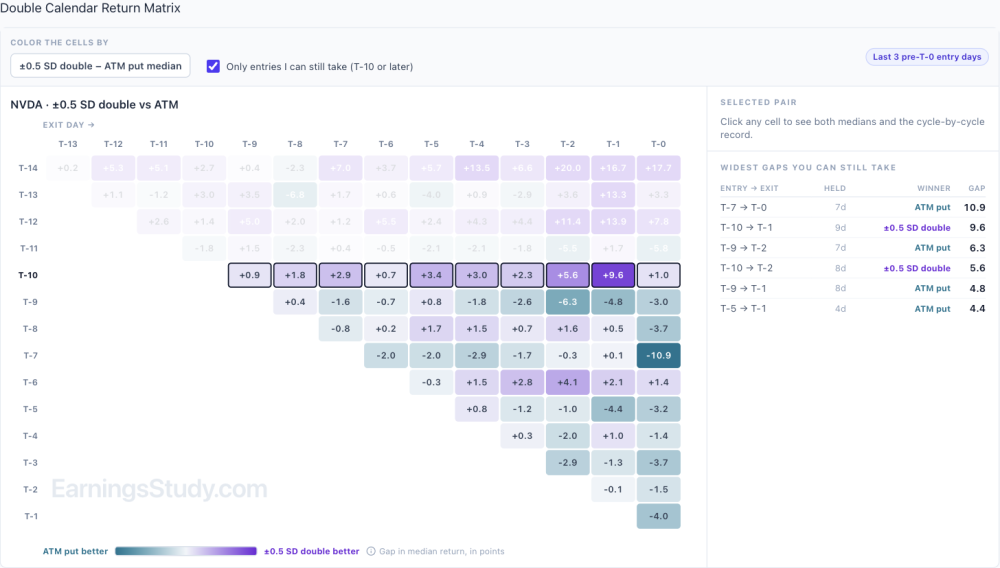
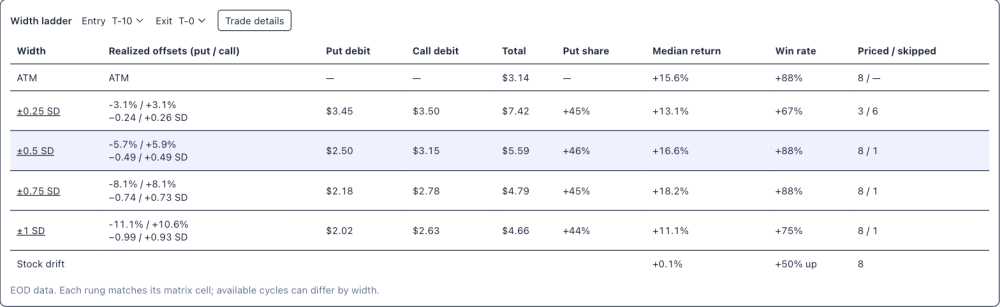
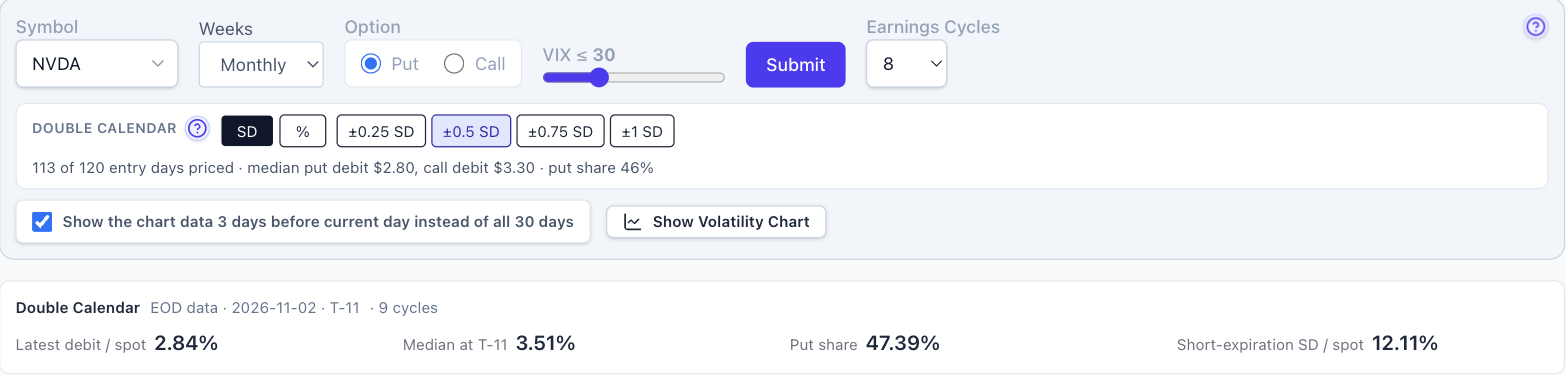
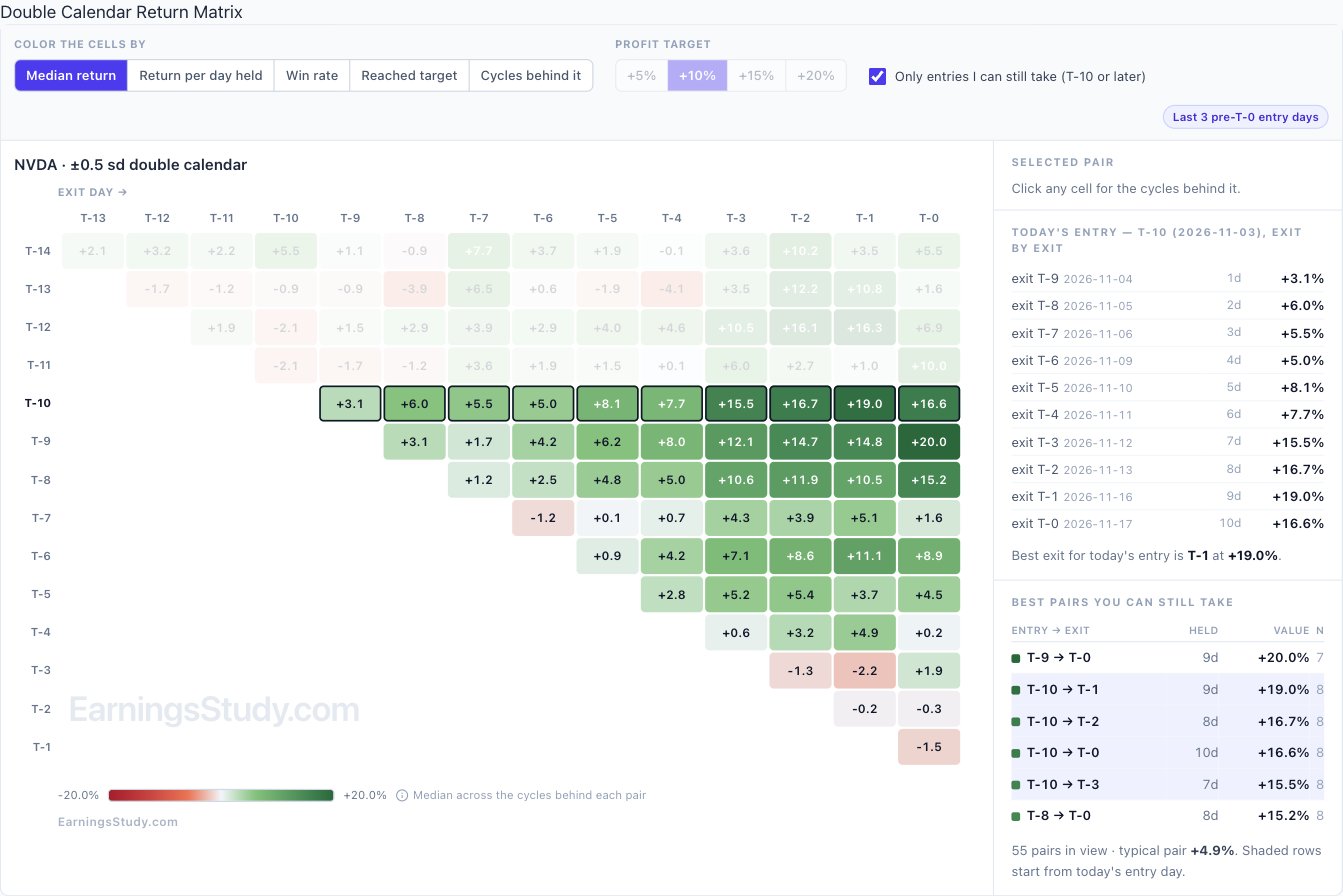
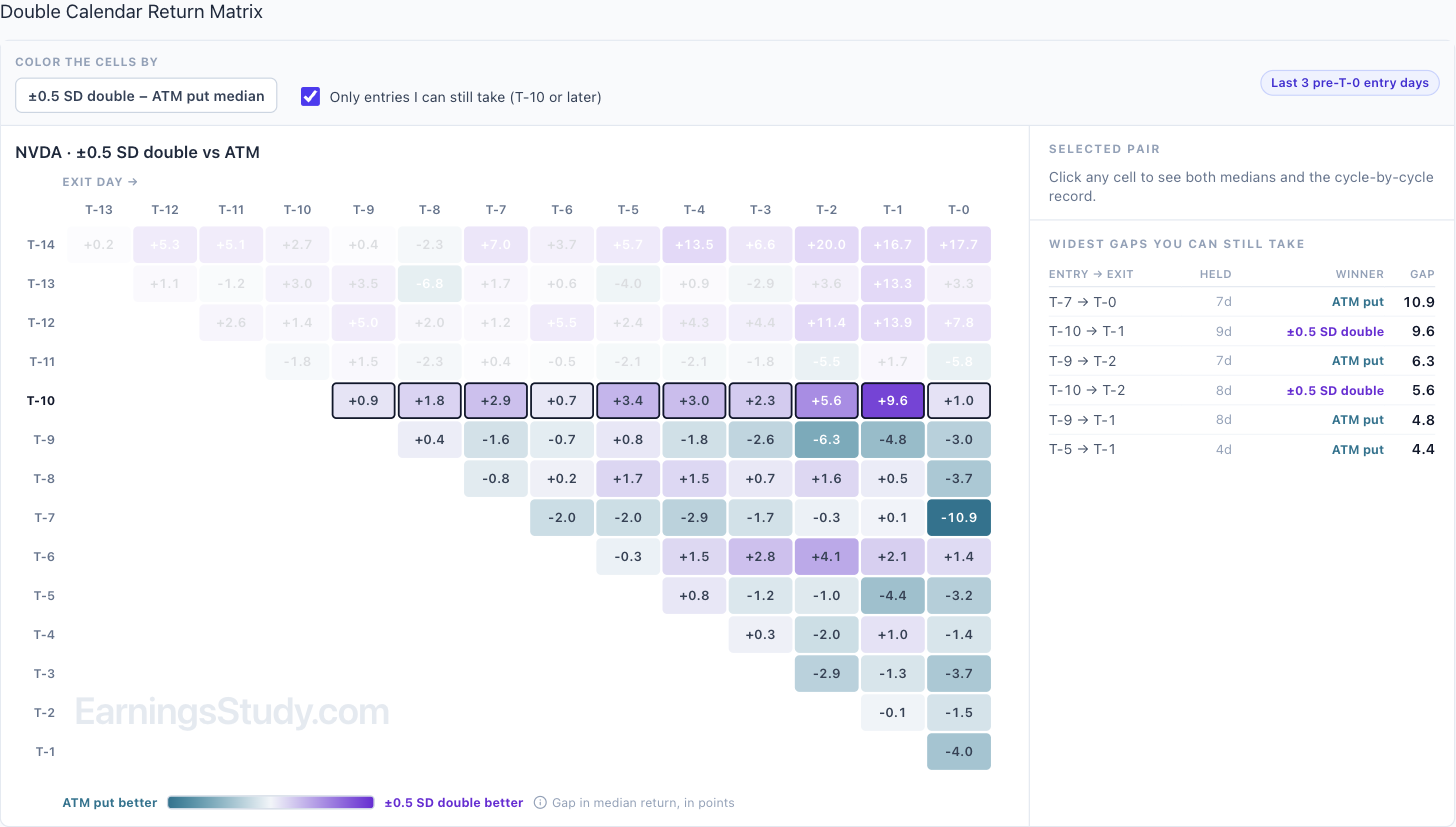
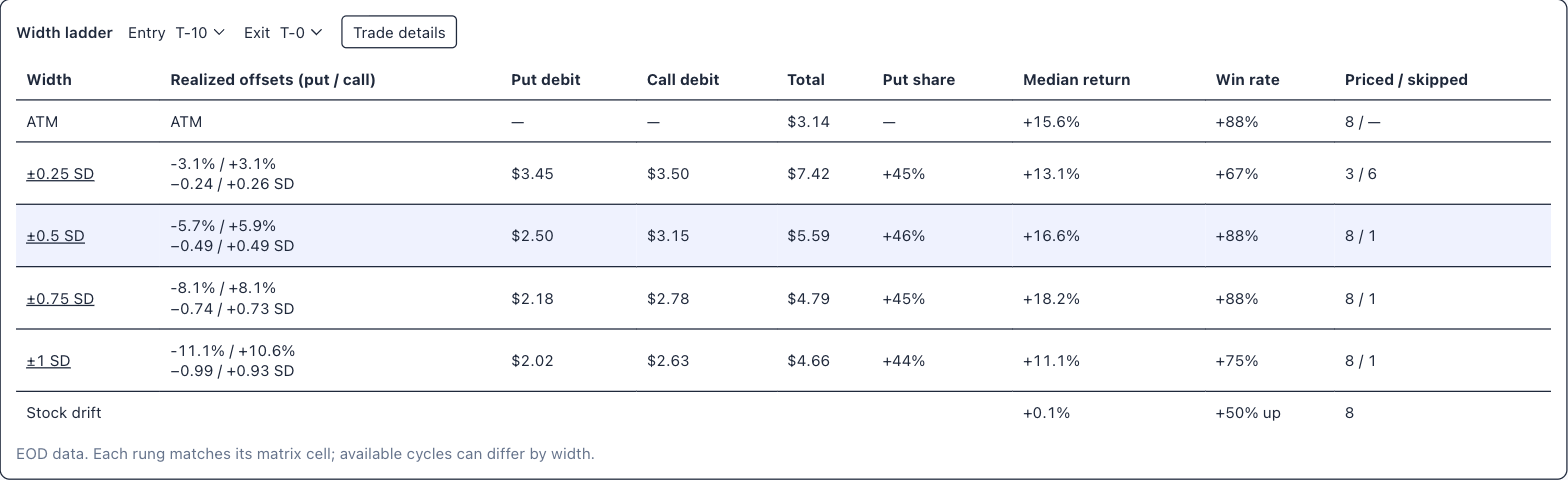
Double Calendar is open Last week I previewed the Double Calendar page. It's open now for every member: look for Double Calendar in the sidebar, right under Calendar. If you'd rather start from the regular calendar, the Calendar page now has a Compare with menu where you can pick Double. Quick recap: a double calendar is a put calendar below the stock plus a call calendar above it, on the same expirations. You set the width in standard deviations of the short expiration (±0.25 to ±1 SD) or as a percent of the stock price. A cycle only counts when both halves can actually be priced. Here's how I'd use it, on NVDA. It reports Nov 17 after the close, so today is T-10. Numbers are from EOD data through Nov 2, at ±0.5 SD. 1. Is it cheap or rich? The summary bar shows today's debit as a percent of the stock against the median for the same day in past cycles. NVDA's double cost 2.84% against a 3.51% median at T-11, about a fifth below its own history. NVDA, ±0.5 SD, EOD Nov 2. 2. What did entering here return? In the return matrix, tick "Only entries I can still take" and read today's row. Entering NVDA's double at T-10 returned a median +3.1% by the next day, building to +15.5% at T-3, +16.7% at T-2 and +19.0% at T-1, and +16.6% if held to T-0. Switch the coloring to Win rate: 7 of 8 cycles finished positive on most of those exits. Across every pair from T-10 on, the typical one returned +4.9%. Return matrix, ±0.5 SD, median return. Today's T-10 row is outlined. 3. Is it better than the plain calendar? Tick "Show ATM Calendar alongside" and each cell shows which one did better, and by how many points. On the T-10 row the double came out ahead on every exit, by anywhere from 0.9 to 9.6 points; the biggest gap was T-10 to T-1. One row down it flips: from T-9 the at-the-money put calendar won most exits, and T-7 to T-0 went to the ATM calendar by 10.9 points. So the edge here comes from the entry day, not from the structure in general. Double vs ATM put calendar, gap in median return (points). 4. Which width? The width ladder puts every width next to the regular calendar for one entry and exit. NVDA from T-10 to T-0: the ATM calendar returned +15.6%, ±0.5 SD +16.6% and ±0.75 SD +18.2%, all with 7 of 8 cycles positive. ±1 SD dropped to +11.1%, and ±0.25 SD priced only 3 cycles because the strikes sat too close to the money. The stock itself moved a median +0.1% over that stretch. Click Trade details for each cycle's strikes and debits, with both halves listed separately. Width ladder, entry T-10, exit T-0. Not every name looks like this. HD, also reporting mid-November, tells a different story at ±0.5 SD. From today's entry on, the typical pair returned −2.1%. Entering at today's T-9 had a best exit of +4.7% three days later and −0.9% held to T-0. That's the reason to run the four checks rather than assume a double is the better calendar. Two cautions. Each cell rests on 7 or 8 past cycles, so treat a number as a sample, not a rule. And the double costs more in dollars than the ATM calendar ($5.59 against $3.14 on NVDA here), so compare them by percent return, which is how the page shows them. Thanks to the members who asked for this. If you trade doubles a particular way (other widths, different expirations for the two sides) or something looks off, send it with the Ask button in the top bar. It attaches the page you're on. Educational research only, not trade advice. Based on EOD data; past cycles don't guarantee future results.
 1 point
This leaderboard is set to New York/GMT-05:00