
Leaderboard



Popular Content
Showing content with the highest reputation on 09/14/26 in Posts
-
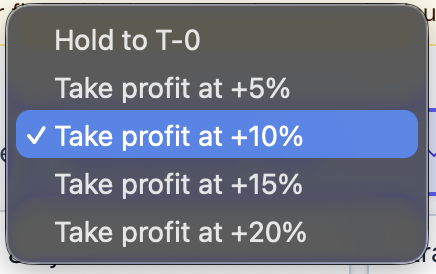
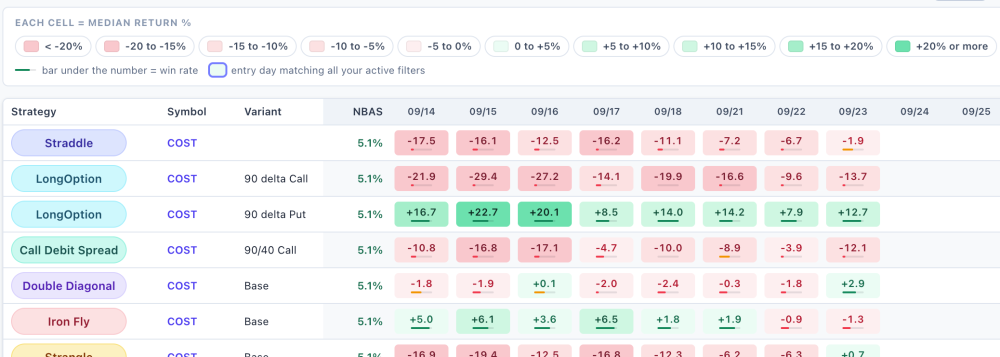
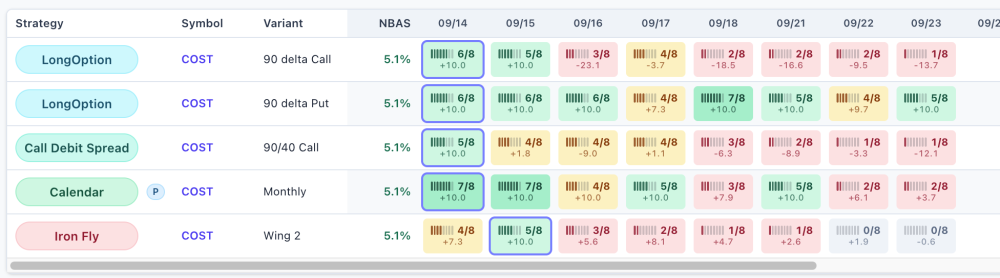
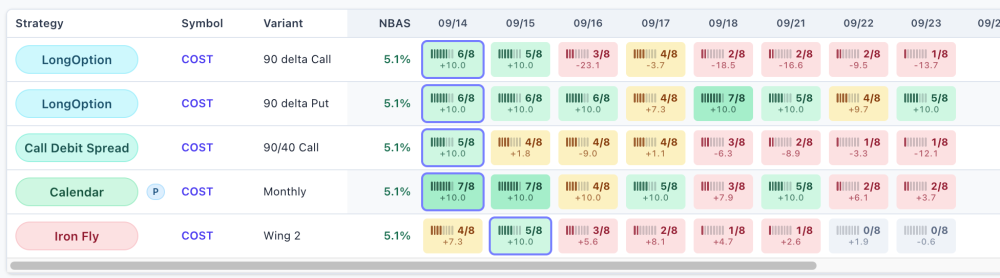
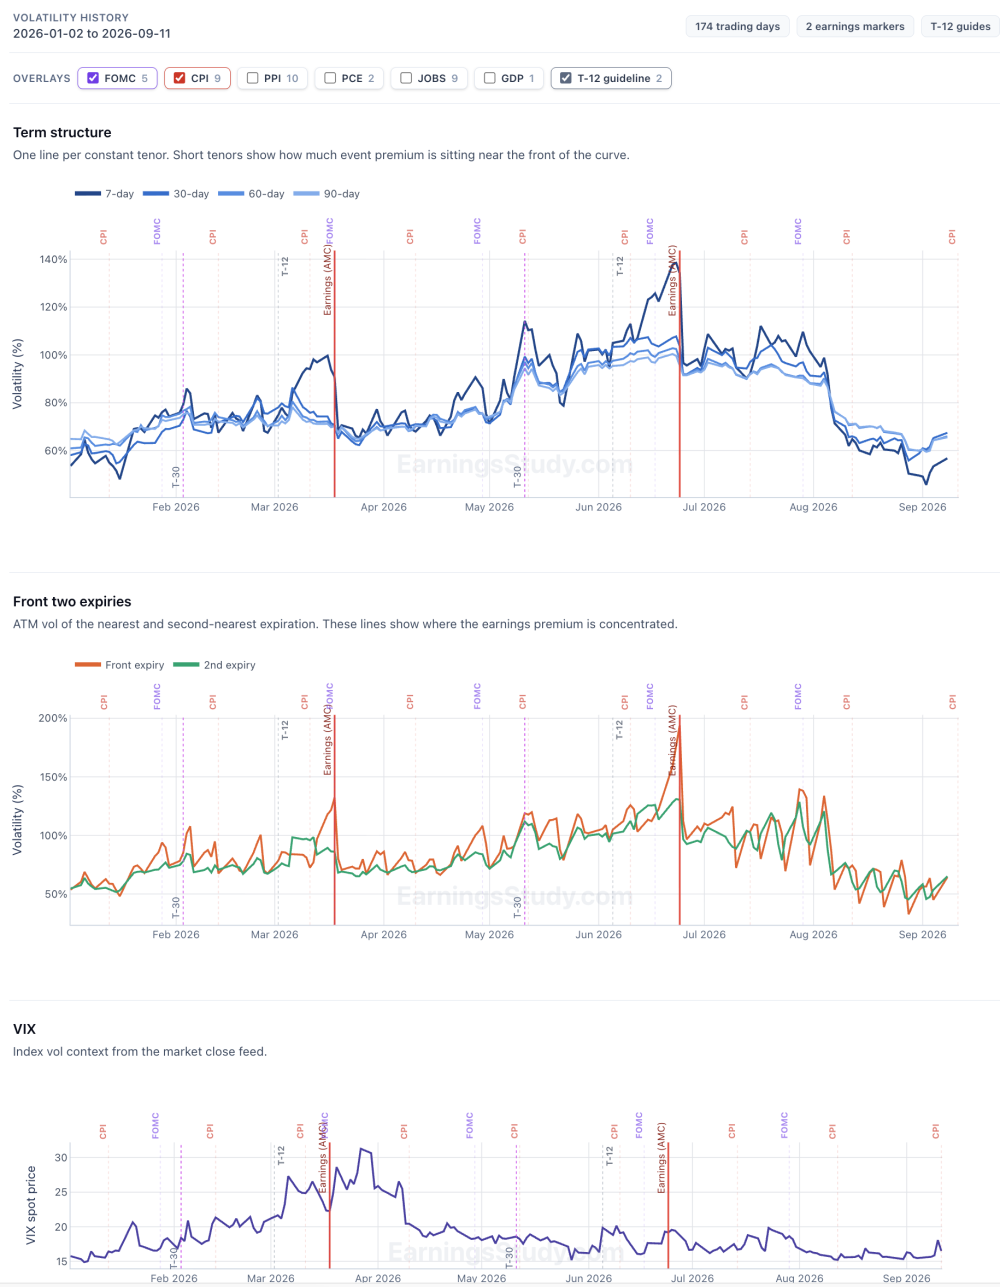
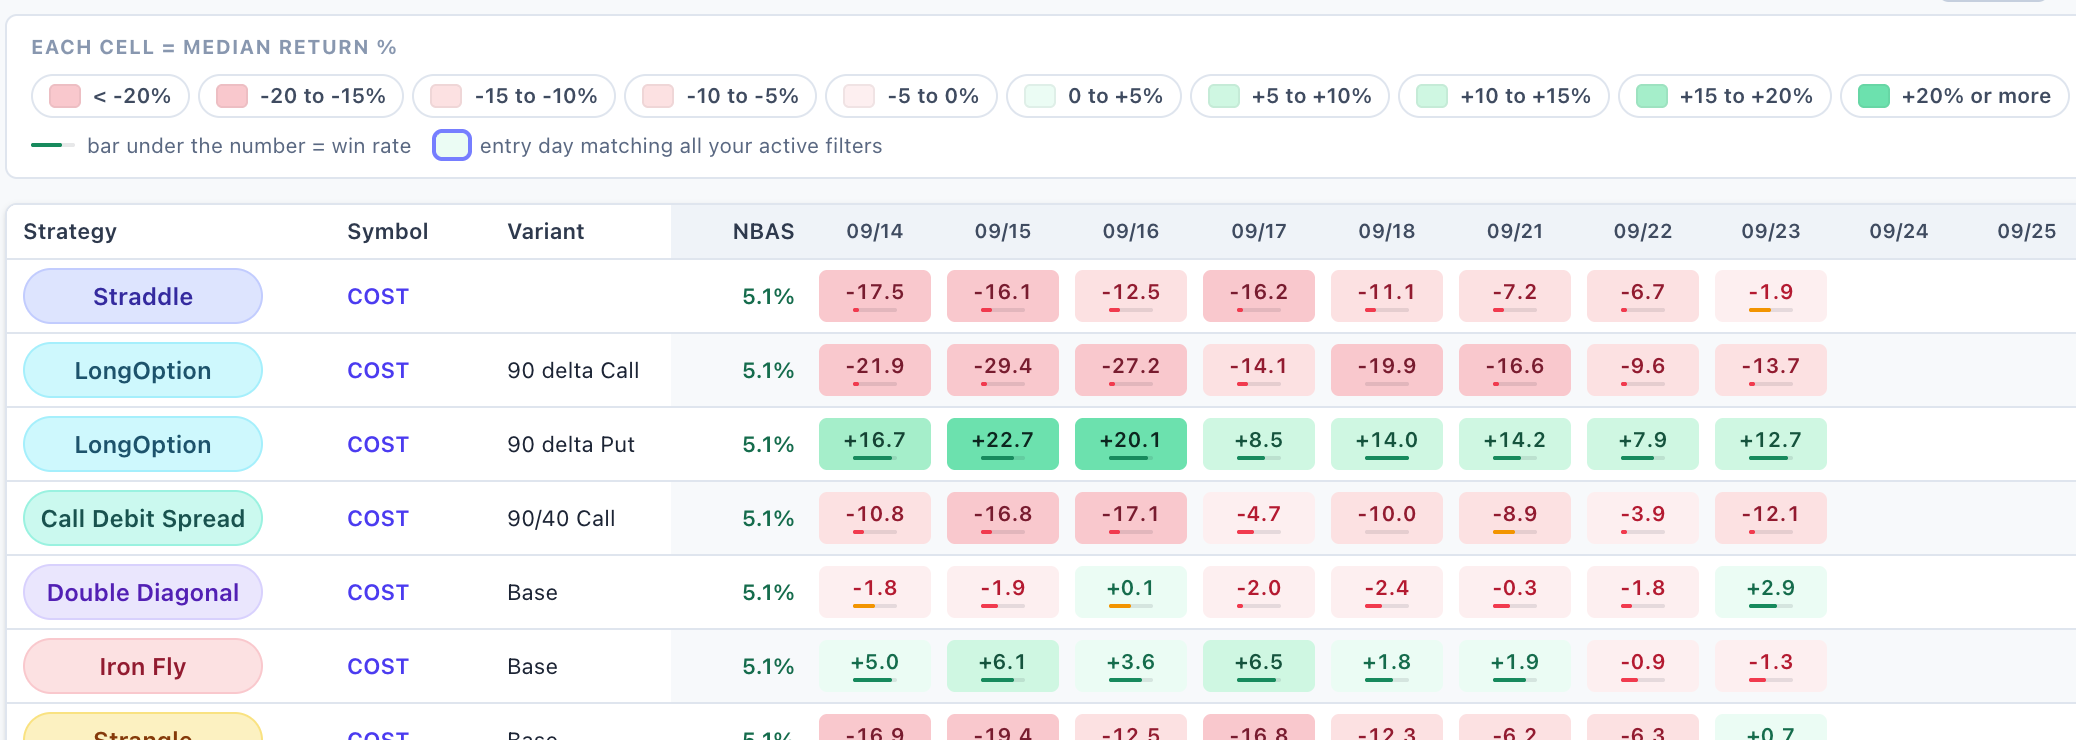
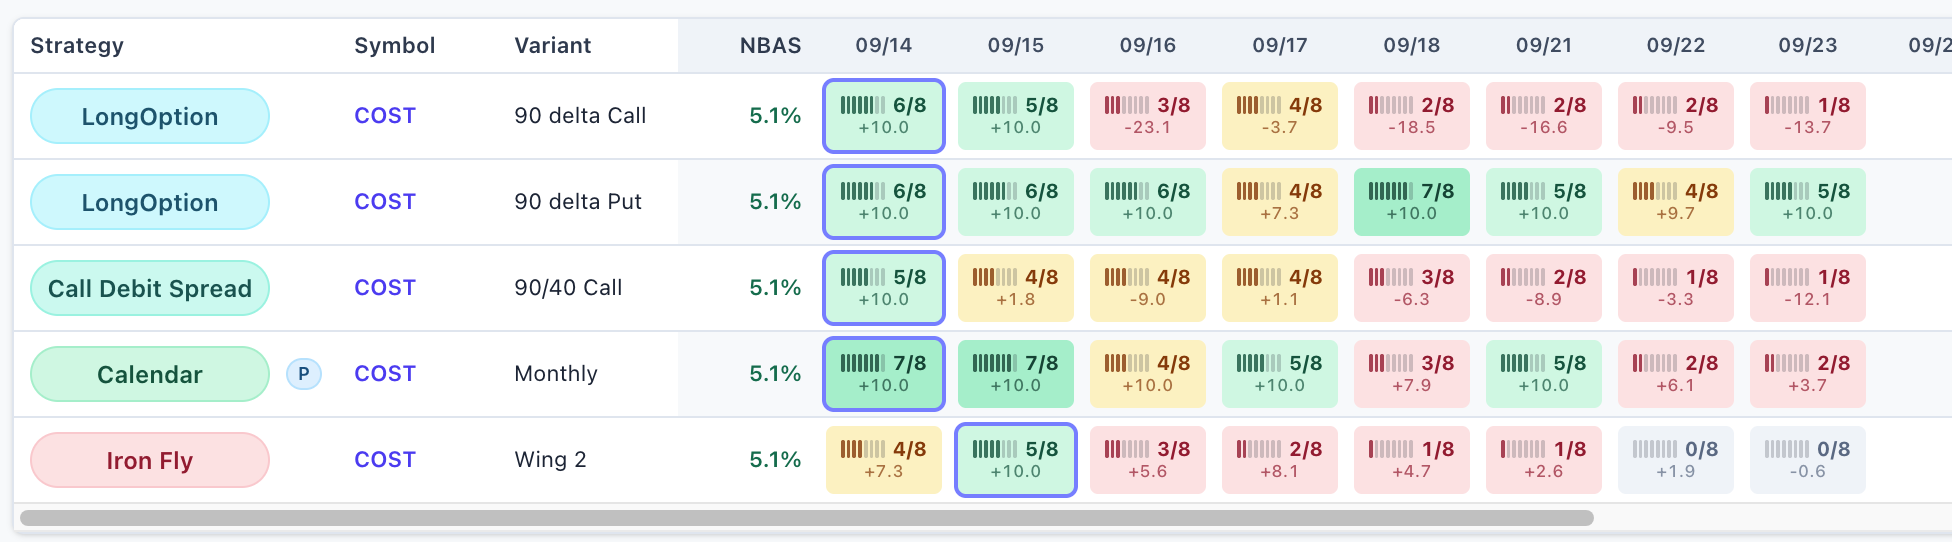
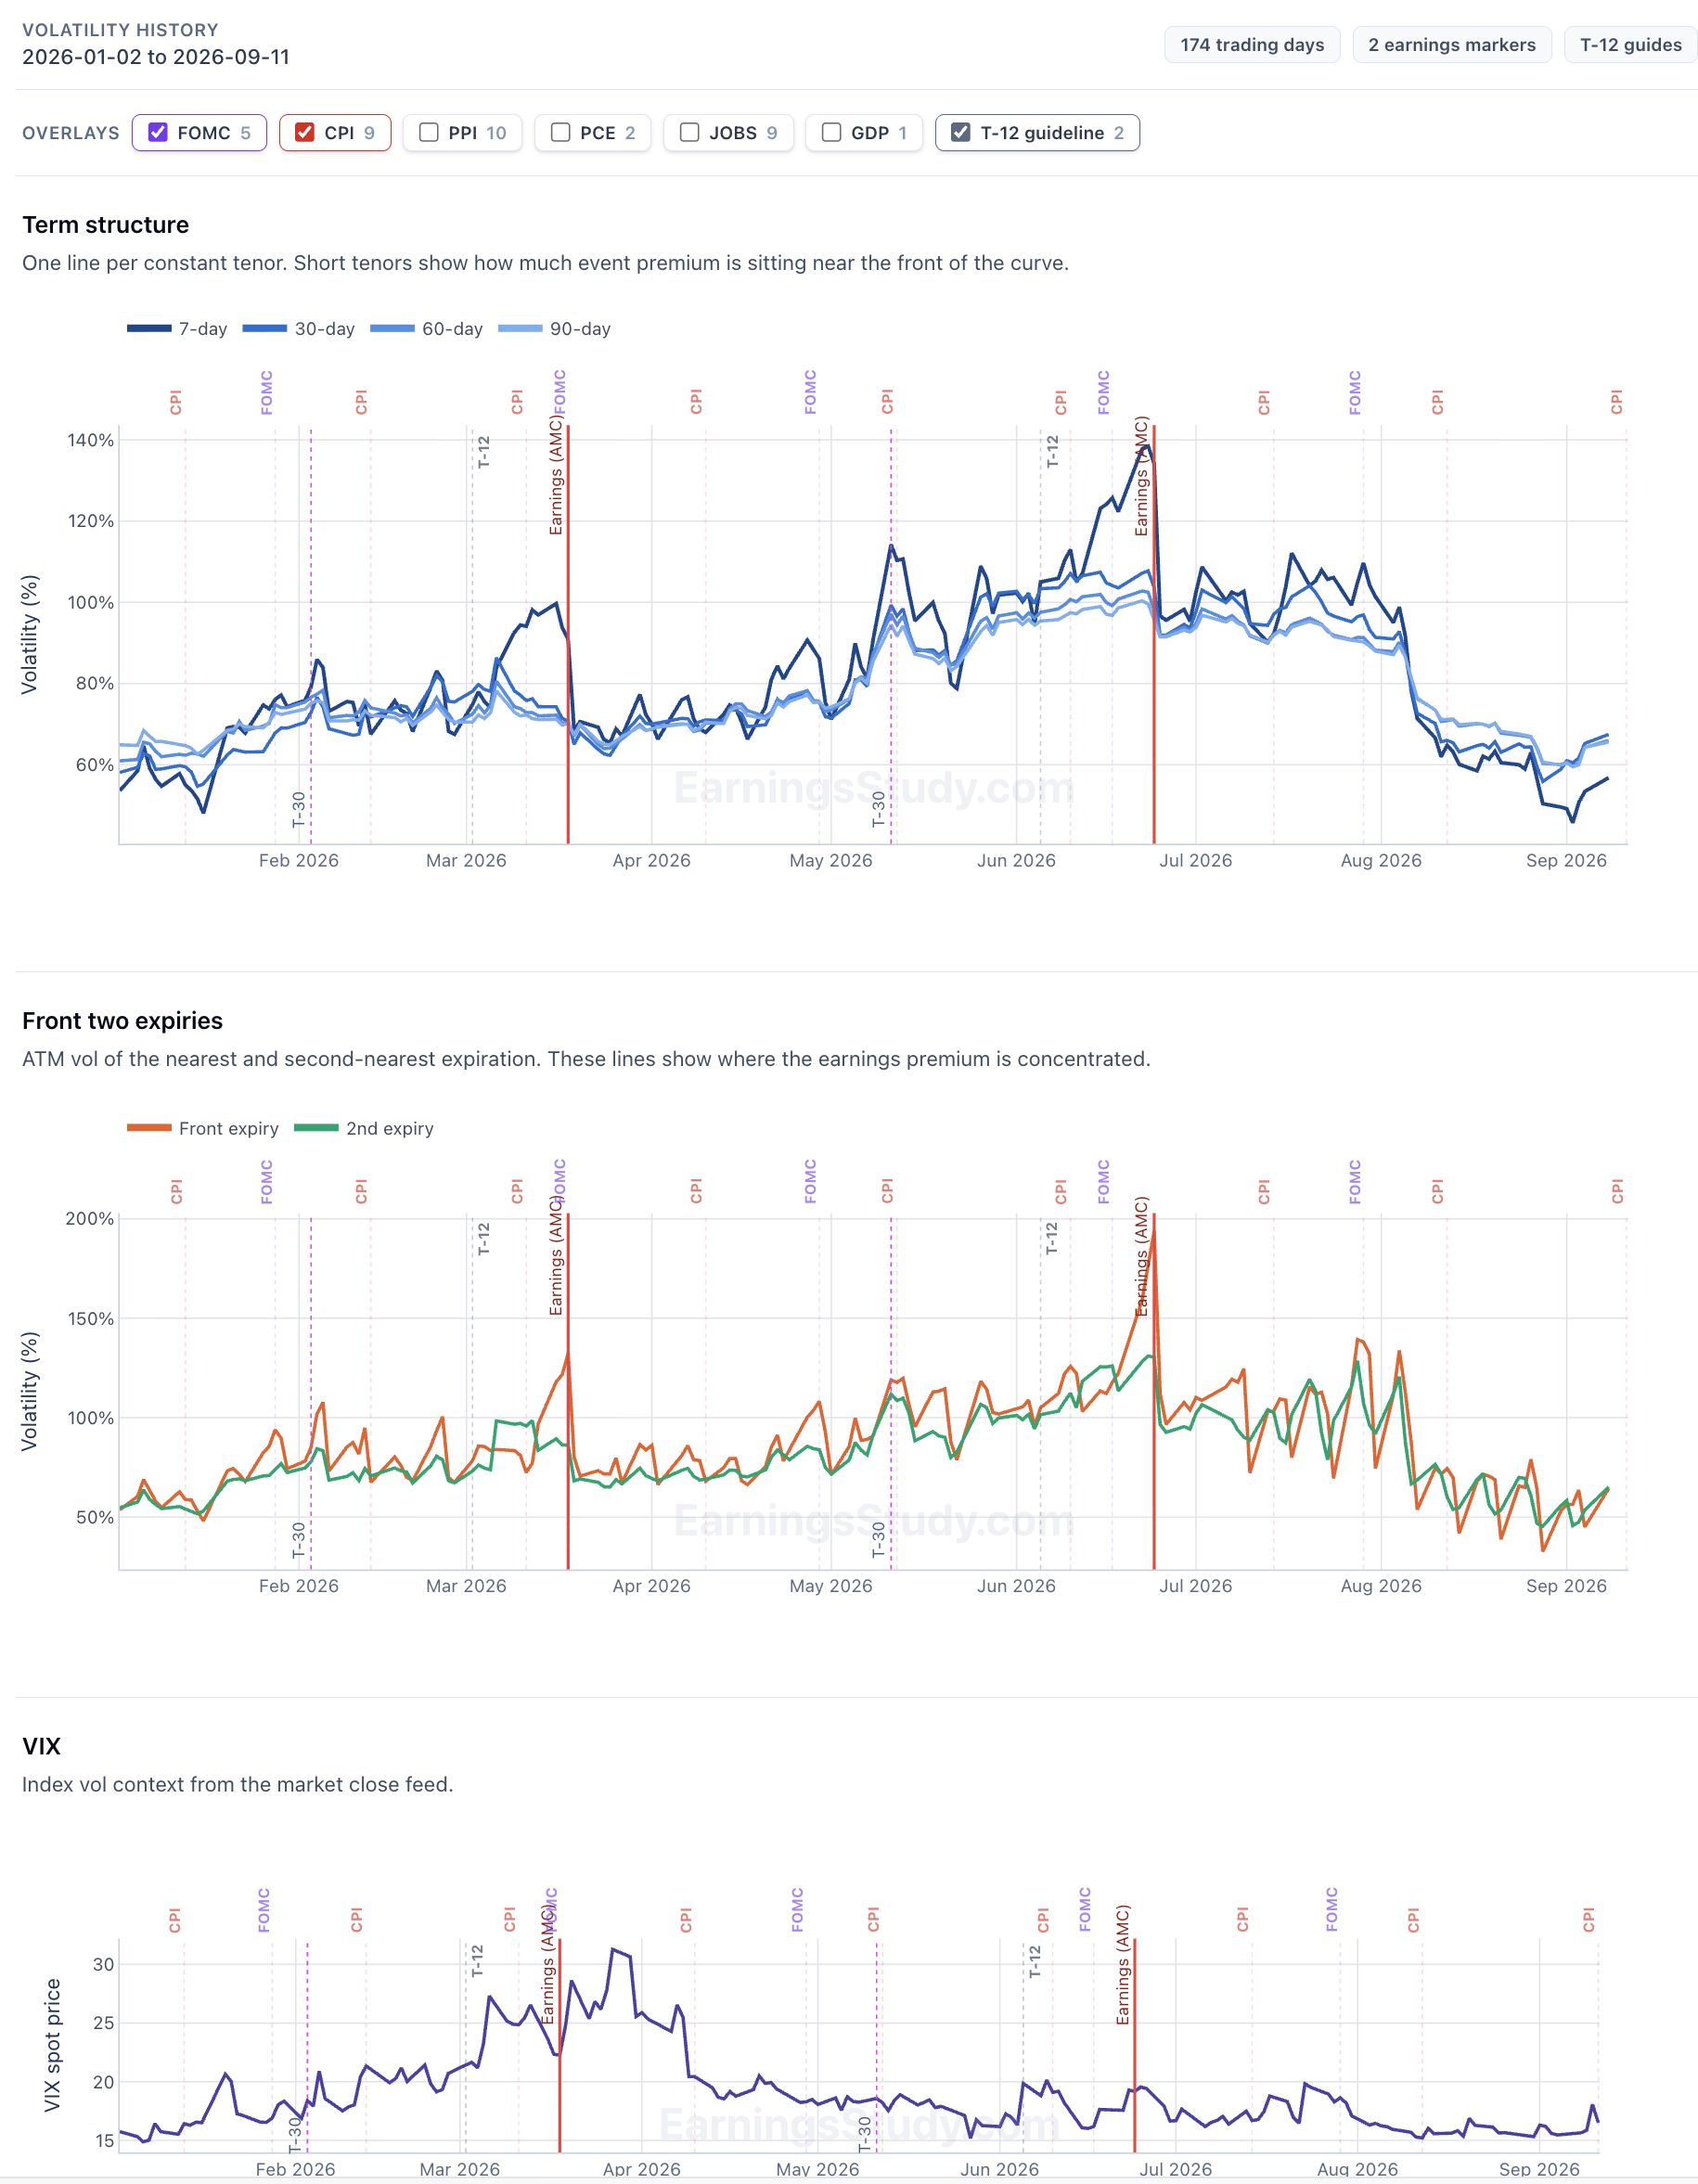
What's new: exit rules on the Daily Screener, and a look at the volatility term structure Two features shipped this week. They came out of the same complaint, which was mostly my own: the screener was very good at telling me when to get in and said almost nothing about when to get out, or about what volatility was doing while I waited. 1. The Daily Screener now understands exit rules Until now the screener answered exactly one question: if I enter on this date and hold to T-0, what did that return across the last N earnings cycles? That's a real question. It's also a strangely rigid one. It assumes you sit through the entire pre-earnings window no matter what the position does — that a trade up 30% at T-7 and a trade up half a percent at T-7 are the same trade, because you're holding both to the same day. Anyone who actually runs these knows that isn't how it goes. You take the money when it's there. So there's now an Exit rule control, and it's the first thing in the filter row. Hold to T-0 is the screener you already know. Take profit at +10% re-scores the whole board against a different plan: leave the moment the position is up 10%, and only hold to T-0 in the cycles where it never gets there. Every number on the page then answers the new question instead of the old one. That's the whole feature. What a cell tells you now With a target selected, each cell leads with how many past cycles reached it — one small block per cycle, filled where it hit — and the median return of that rule underneath. The block strip matters more than it looks, because it carries the sample size as well as the hit count, and the number of qualifying cycles isn't the same for every symbol. A newer listing might only have two or three on file. 2 of 2 and 8 of 8 are both perfect scores; only one of them is evidence, and now you can tell which without opening anything. Grey cells are their own answer: no cycle ever reached the target, so every cycle fell back to holding and the figure shown is just the hold-to-T-0 return. Not a target result at all. The example that convinced me This is COST, real board, last N cycles. Held to T-0, the 90-delta long call is a bloodbath across the first three entry days: −21.9%, −29.4%, −27.2%. On the old screener you'd skip it without a second thought, and you'd be right to. Switch the exit rule to +10% and the same three entry days read 6 of 8, 5 of 8, 3 of 8. The trade gets there. It just doesn't stay there. Held to the end it hands everything back and then some; taken at +10% it worked in six of the last eight cycles from that entry day. Click any cell for the receipts (Full details shows up on the right pane) [Subscribe to see more details] 2. Volatility term structure, through the pre-earnings window The second feature answers a different complaint: IV is up — is that my earnings, or is that the macro calendar? The volatility chart now plots the term structure across the run-up: the 7, 30, 60 and 90-day tenors together, plus the front and second expiry IV, from T-30 through to earnings. Seeing the tenors on one axis is the point. A front expiry pulling away from the back of the curve is the earnings premium building, and you can watch it happen day by day instead of inferring it from a single number. Flat separation means the premium isn't there yet. Macro events are marked on the same timeline — FOMC, CPI, PPI, PCE, jobs, GDP — which is what stops you misreading the chart. IV rising into your entry doesn't automatically mean the earnings premium is inflating; sometimes there's a CPI print sitting inside your holding window doing it instead. Those are two different trades and they deserve two different decisions. Where to find all this The profit-target view is now the default Daily Screener. Nothing is hidden — set the exit rule to Hold to T-0 and you have exactly the board you had last week, and the Classical View button next to the filters takes you back to the old layout entirely. There's also a Help button on the screener now that opens a full walkthrough in the side panel: how to read a cell, what the colors mean, and the win-rate-versus-hit-rate distinction above. Worth five minutes before you rely on the numbers. How I use it now Spread filter to the tightest bucket first — liquidity before edge, as always. Exit rule to +10%, Hit rate % to 60% or more. Scan for strong cells in the early columns. An entry day well before earnings gives the target room to get there. Open the cell and read the cycle list before committing to anything. If the hit rate rests on two cycles, I haven't found anything yet. As always: if there's a number you wish the screener showed, send me a message. That's how both of these got built. SO members on the ALL bundle: full core access to EarningsStudy is free through the partnership — just sign in at earningsstudy.com with your SO email. Everything above is historical and educational analysis, not a trade recommendation or financial advice. Options trading involves substantial risk. Historical figures are derived from end-of-day data and will differ from intraday markets and from your actual fills.

 3 points
 -
Two things from my side this weekend. A guide. I've written the document I wish every options tool came with: Reading OptionBench — 26 pages, one screen at a time, on what each number means, how it was computed, and where it stops being reliable. The two return conventions (observed exit vs target), why thin samples are greyed, how to read the entry × exit matrix, why a credit spread shows an expectation near zero at implied vol. Free, no account needed: https://optionbench.com/guide An article. When implied volatility hits its floor, does it come back up? — 6,600 episodes, 122 tickers, earnings controlled. The folklore is right: from a floor, IV rises within ten sessions 74% of the time against 57% from anywhere else, and the lower the start, the stronger the bounce. It also says why that isn't a strategy yet: https://optionbench.com/blog/implied-volatility-floor-mean-reversion The follow-up comes next: I tested the structures that are supposed to capture that rise — single leg, straddle, calendar, diagonal — one configuration each, declared before looking at the data, priced at the ask in and the bid out. The result isn't what the folklore says. It'll be published whichever way it reads. Questions and objections welcome, as always.1 point

This leaderboard is set to New York/GMT-04:00