
Leaderboard


Popular Content
Showing content with the highest reputation on 07/06/26 in Posts
-
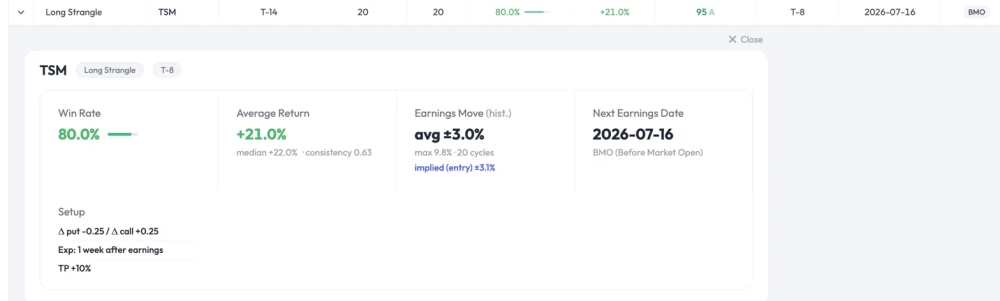
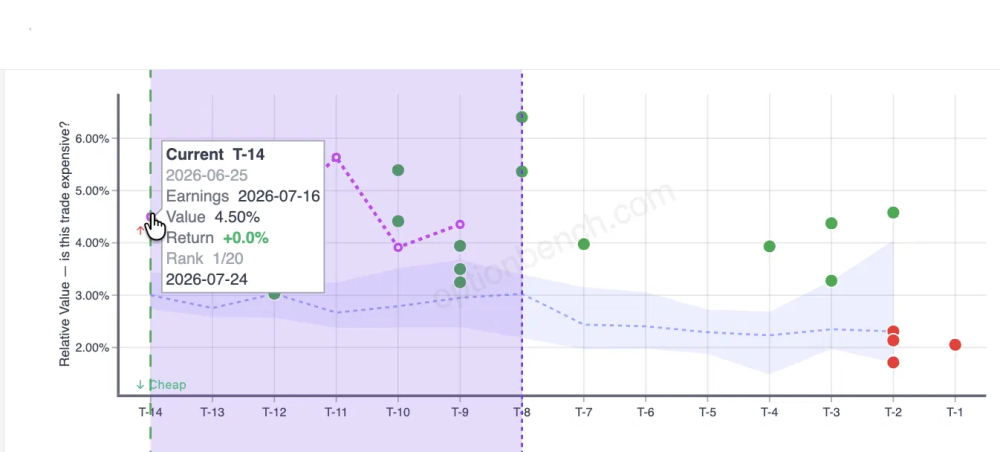
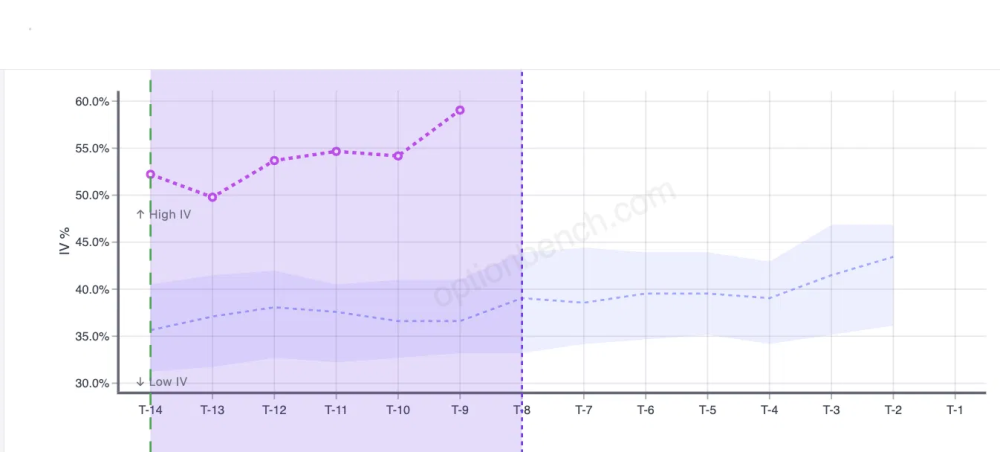
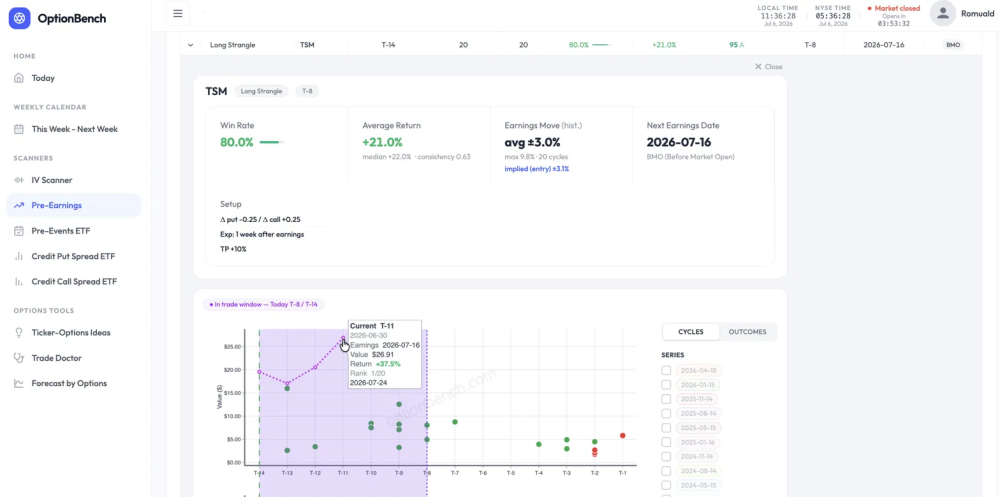
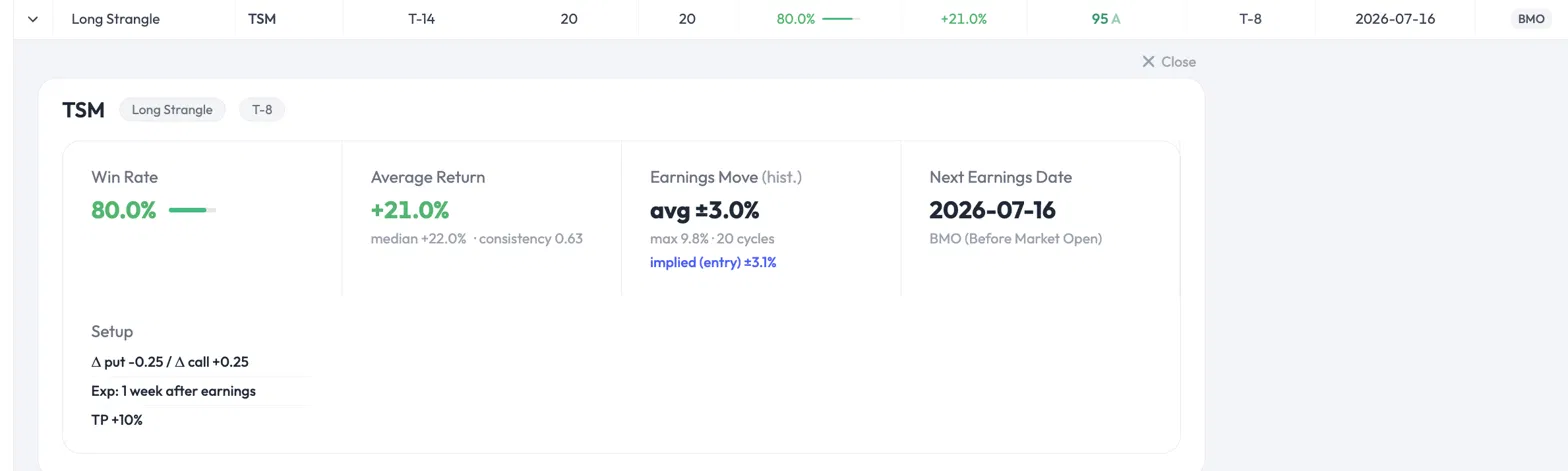
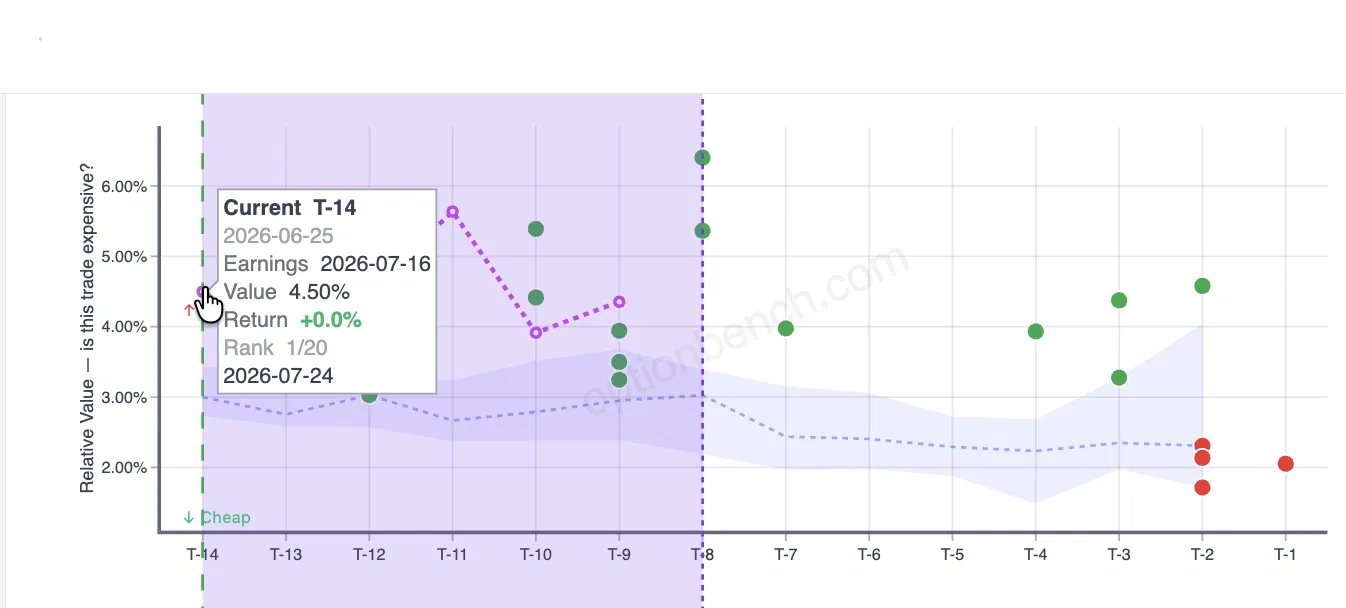
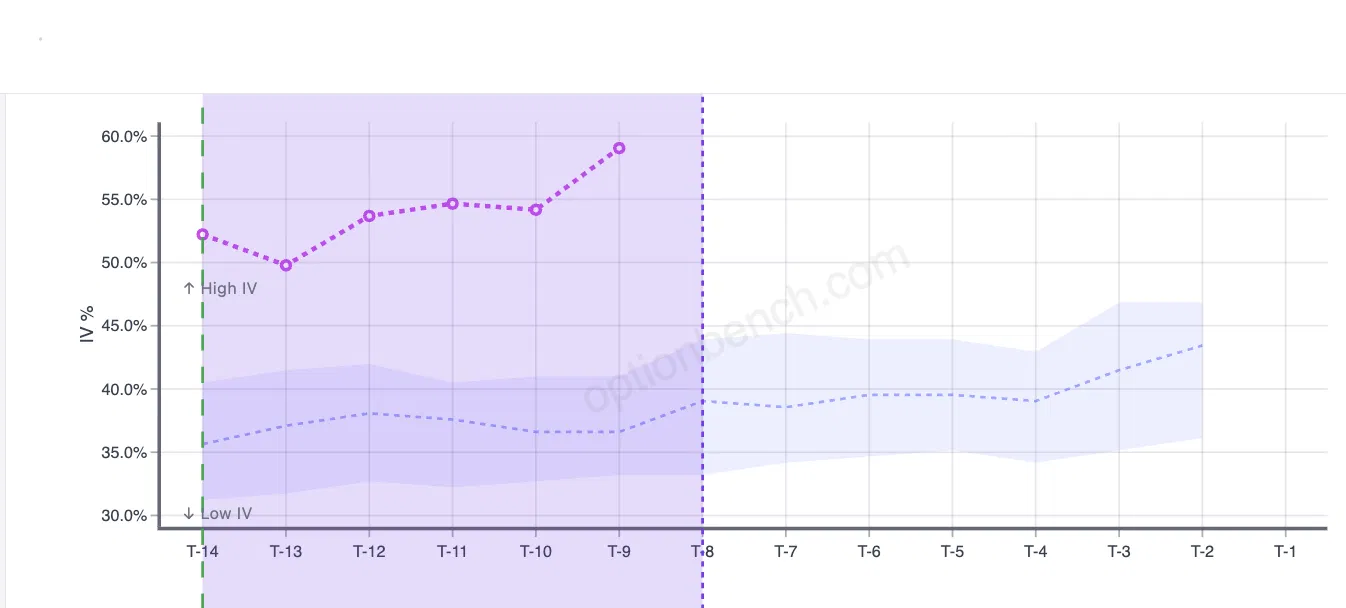
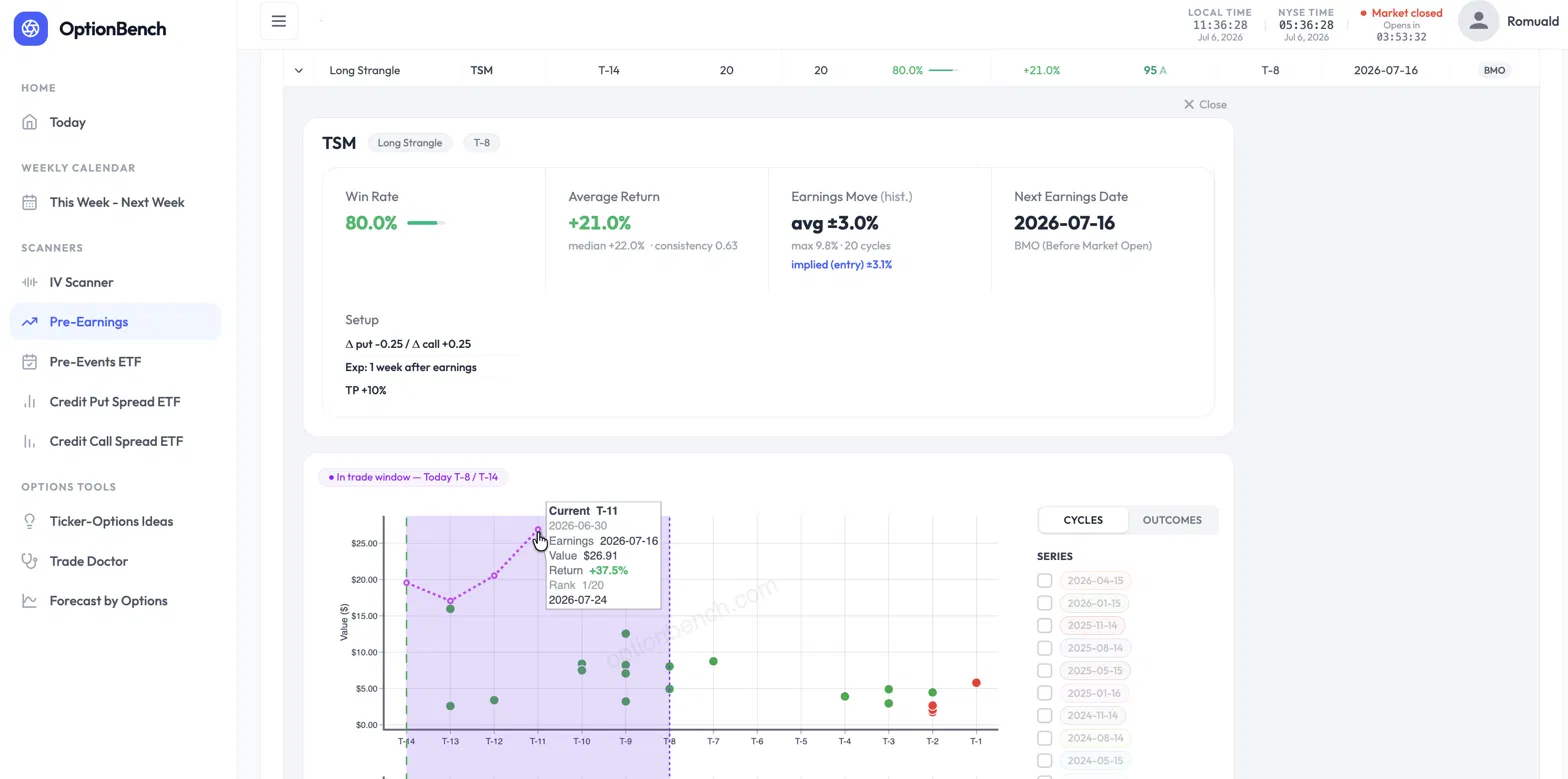
An 80% Win Rate on One of the Most Expensive Entries in the Ticker's History. Would You Take It? Here's a trade the OptionBench pre-earnings scanner flagged, and a question worth sitting with before you read the answer. [CAPTURE 1 — Win Rate 80% / Average Return +21% (median +22% · consistency 0.63) / Earnings Move avg ±3.0% implied ±3.1% / Next Earnings 2026-07-16] TSM reports earnings on July 16. The scanner flags a Long Strangle entered fourteen trading days out — on Thursday, June 25 — with Δ ≈ 0.25 on each side, expiring one week after earnings, taking profit at +10%. The headline numbers look strong: an 80% win rate over 20 past cycles, a +21% average return, a +22% median. Then you look closer, and two things should make you hesitate. First, the strangle is expensive. Its cost as a share of the underlying — the entry's relative value — sits at 4.5%, against a historical average of about 3.1% at this point in the cycle. Second, implied volatility is elevated: around 52% at entry, climbing toward 59%, well above the ~37% this name usually carries here. Every instinct trained on "buy low, sell high" says the same thing: it's expensive, IV is high, wait for it to come back down. And here's the part that should really give you pause — this entry isn't just above average. It ranks among the most expensive entries the scanner has on record for TSM at this point in the cycle, with implied volatility near the very top of its historical range. So: one of the most expensive entries on record, IV at its highs, and every reflex telling you to pass. Would you take the trade? The instinct that costs you the trade Most traders pass here, and their reasoning feels airtight: if it's the priciest it's ever been, mean reversion says it gets cheaper, so I'm overpaying. That reasoning conflates two different things — the price of the option and its expected value. They are not the same axis, and treating them as one is the single most common way traders talk themselves out of good pre-earnings trades. Let me show you why, with this exact trade, using numbers you can pull from the scanner yourself. "Expensive" is not the same as "overpriced" The first question a rigorous trader should ask isn't "is this expensive?" It's "is the market pricing the move correctly?" [CAPTURE 2 — Relative Value « is this trade expensive? », tooltip T-14 : 2026-06-25, Value 4.50%] The scanner answers this directly. Two figures sit side by side in the banner: Implied move at entry: ±3.1% — the move the strangle prices in, averaged across the 20 past cycles at this entry point. Realized earnings move: ±3.0% — the actual average move TSM has made on earnings, same 20 cycles. These are essentially equal. The market is not systematically underpricing TSM's earnings move, and it isn't wildly overpricing it either. The strangle is priced fairly relative to what the stock actually does. So if the option is fairly priced on the move, where does an 80% win rate come from? If the market gets the move right, the edge can't be coming from a mispriced move. It isn't. And that's the whole point. Where the edge actually lives The edge in this trade is not a bet that TSM moves more than the options imply. It's the capture of IV expansion into the event. [CAPTURE 3 — IV % : IV rising from ~52% (T-14) to ~59% (T-9), above historical band ~37%] You enter at T-14. The plan is a good-till-cancelled order to take profit at +10%, exiting before earnings and the volatility crush. And if the +10% never triggers? You still exit before the print — the position is closed at T-2 (for a before-market report) or T-1 (for an after-market one), no exceptions. You never carry the trade through earnings. That's the key risk control: this strategy has no exposure to the earnings gap itself, win or lose. In the window you hold the position, the option premium tends to inflate as the market crowds into the event. You're not holding through the print and hoping for a big move. You're buying anticipation and selling it a few days later, richer. [CAPTURE 4 — Value $, tooltip T-11 (2026-06-30) : Value $26.91, Return +37.5%, Rank 1/20] On the current cycle, that's exactly what played out. Entered at T-14 near $19.57, the strangle was marked at +37.5% by the close of T-11 (June 30) — and earnings hadn't even happened yet. Now, you wouldn't have pocketed +37.5%: your +10% GTC would have filled well before that, somewhere in the intraday tape as the position ran up. The realized gain is +10%, the take-profit. But that +37.5% end-of-day mark is the evidence that the target was hit comfortably, and early. The move you'd have been "waiting to see" is irrelevant to this trade, because you're out before it happens. This reframes "expensive" and "high IV" completely. They aren't warning signs to avoid. They're the fuel. A cheap, low-IV strangle would have far less premium to expand. You want the anticipation. You're selling it, not buying into it. (One honest note for the careful reader, because it matters: the "realized move" measures the one-day earnings gap, while the "implied move" is priced by an option that lives a full week past the event. They're not a perfect apples-to-apples comparison — the option captures the gap plus residual post-earnings vol. If anything, that makes the "fairly priced" read conservative. I'd rather flag it than have someone catch it and assume I was hiding it.) What should have driven the decision Not the price. Not the IV level. The conditional statistics — the numbers the scanner exists to surface: Win rate: 80%, conditional on entering at T-14, over 20 cycles — meaning 80% of those cycles hit the +10% take-profit before the event. (It's a TP-hit rate, not a vaguer "was it green" rate; worth being precise, since it's the number the setup is actually built around.) Average return +21%, and — this is the one that kills the "it's an outlier" objection — median return +22%. The median sitting at or above the mean tells you the average isn't propped up by one lucky cycle. The typical outcome is a strong winner. This is a regular edge, not a lottery ticket. That distinction is everything. An 80% win rate with a median of +22% is a fundamentally different animal from an 80% win rate where the average is dragged up by a single monster cycle while everything else limps. The scanner shows you which one you're looking at, and here it's the good kind. The honesty that makes this defensible I'm not going to pretend this is a free lunch, because it isn't, and the scanner won't let me pretend. There's a consistency ratio of 0.63 on this trade — mean return divided by the standard deviation of per-cycle returns. It measures how regular the edge is, and 0.63 is moderate. The edge is real and it repeats, but there's genuine dispersion: the 20% of cycles that lose, lose meaningfully. This is a trade to size with control, not to back up the truck on. That's not a caveat buried at the bottom. It's the point. A tool that only ever tells you a trade is great is a marketing tool. A tool that hands you an 80% win rate and a 0.63 consistency ratio in the same breath is giving you what you need to size the position honestly. And one more line I won't blur: the current cycle is a single live data point, and a single data point proves nothing. That the take-profit was hit early this time is encouraging, not evidence. The case for entering doesn't rest on it. It rests on the 20-cycle conditional distribution: 80% of cycles hitting the +10% target, a +22% median across all of them. The live cycle is an illustration of that statistic playing out, not the proof of it. If you take one thing from this piece, take that sentence. The takeaway Don't confuse the price of an option with its expected value. They live on different axes. An option can be among the most expensive it has ever been — near the top of its own historical range, IV at its highs — and still be the right trade, because the price of the option and the odds of the trade are two separate questions. "Expensive" answers the first. The 80% win rate, the +22% median, and the 0.63 consistency ratio answer the second. That second set is what should drive the decision. The whole reason a tool like this earns its place is that it puts both answers on the same screen — so you're not passing on a good trade because an instinct trained on the wrong axis told you it looked expensive. Numbers in this piece are pulled directly from the OptionBench pre-earnings scanner (TSM, Long Strangle, T-14 entry on June 25, 2026, 20-cycle sample). Every figure — implied vs. realized move, median return, consistency ratio, entry relative value — is visible in the tool. Verify them yourself; that's the point. Beta-testing is ending by the end of July but you can still give your feedback and ask for signing in on the OptionBench Beta Web Site.
 2 points
 -
@Romuald first test run was a success as BAC hit 10% target just after open .... that write up is awesome very worthy of a second or even third read ... thanks1 point
-
Good morning Romauld, Great Analysis and discussion! Thank you. Sarang1 point

This leaderboard is set to New York/GMT-04:00