Leaderboard


Popular Content
Showing content with the highest reputation on 05/13/20 in Posts
-
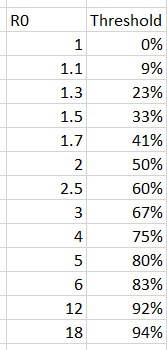
That's not even a guarantee that we are able to create a vaccine that works and is safe. I hope that we find one, but there is always the possibility that we are not able to find one that fast. I'm not a medical professional nor an epidemiologist. But a crude rule of thumb is that the herd immunity threshold is equal to (1 - 1 / R0), with R0 the basic reproductive number (depending on the virus and how people are behaving, on average 1 persons infects R0 other people). Keep in mind that R0 is behaving kind of 'exponentially', so going from a R0 of 1 to 2 has huge consequences. Here is the table. R0 of 12-18 is for measles (as a reference). R0 depends on the virus itself but also how society and people behave (washing hands, density of population, masks, public transportation, etc). Estimating that R0 is quite difficult from what i understand, and you can see the effect of the error of measure on the thredshold needed. Maybe R0 is between 2 and 6 ? If that's the case, then you need between 50% and 83% of the population immune to the virus to break new infections.
 3 points
 -
In the Netherlands the amount of deaths per week rose by 50% above the normal annual weekly average. I think this number is the most reliable indicator of Corona deaths because it is the only extraneous factor that could cause such a jump. In fact due to lockdown the number of deaths should drop a little as there is less risk to get - say - run over whilst in confinement. The officially reported corona deaths are 50% of these extra deaths - rounding the numbers it looks like this - Normal average deaths per week 2600 (this average varies per week and is influenced by seasons - however the relation below has been in existence for the past 2 months more or less) - current deaths per week 3600 - deaths officially attributed to CORONA 580 If we take that as a reasonable extrapolation then the current amount deaths in the US would be 160,000 or so. This is a lot but compared to Spanish influenza its still very modest. That killed overall 675,000 Americans on a population of ca. 100M. which is 0.6% Currently there are 325M Americans and the percentage of deaths by CORONA (if we take the extrapolation I made) is 0.05% - of course we are just at the start. The Spanish influenza lasted about 4 years in total so we may yet get to the 0.6% on the longer run before we have this thing under control. Extrapolating further we could say that the virus has been with us 3 months - if it were to last 4 years - then we need to expect a 16 fold increase (presuming its linear which it certainly is not) - this would get us to 0.8% deaths of the population or a staggering 2.6M deaths. The Spanish Influenza showed that lockdowns and social distancing works to curb the curve - if we dont hit the 2.6M number in the US you can say you did better than might be expected. Anything over would show a failure of leadership, anything substantially lower would show good leadership. The numbers really are quite similar to the previous epidemic and the reactions and pitfalls remain the same. Finding a vaccine and producing it in sufficient numbers (I understand from my clients in that sector that 1B vaccines are needed world-wide) is key to breaking this chain. In the mean time we can only mitigate the process by acting responsibly.3 points
-
some additional evidence re true death counts:https://www.economist.com/graphic-detail/2020/04/16/tracking-covid-19-excess-deaths-across-countries2 points
-
I think the problem with the statistics and models right now is that there is a HUGE margin of error in them - caused by incomplete/errorneous data going in. The problem is this margin of error is not communicated when the models and stats are presented to the public. Comparing stats from around the world is very inaccurate too, as many coutries are understating totals, while others are as accurate as they can be. Many people wind up not believing the models because, not surpringly, they can be inaccurate. Governments are forced to make life changes decisions against the competing medical and economic factors - not an easy decision, made even worse (in the US at least) by everything being highly politicized. My "crystal ball"... As more randon testing occurs we find that infection rate is much more widespread, so mortality rates are much lower (more in-line with flu). But, unlike flu, the diseases spreads much more easily so many more people are impacted. Wide disparity in mortality between younger/healthier people compared to older/co-morbidity people. As more time passes with many people facing severe financial hardship, I think its inevitable that governments will be forced to open their economies as much as then can while trying to isolate and protect those with higher risks as much as possible. Once we hit this phase is where we will be forced to see if the hospitals can keep up with the volume.1 point
-
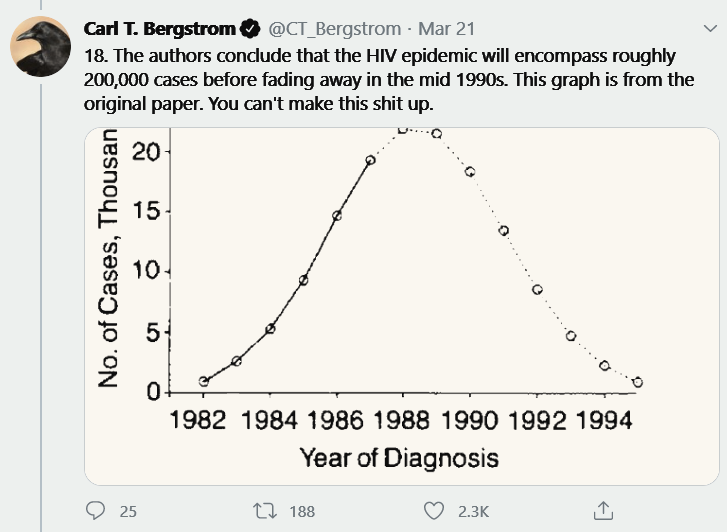
That's not always the case. See for example https://twitter.com/CT_Bergstrom/status/1241551788454473728?s=20 (and the whole thread). There are still many things that we don't know about the virus, i would not be so quick to jump to any conclusions.
 1 point
 -
I've already addressed the CMS diagnostic related group payments in this thread. This talking point is largely BS and propagated (in my experience) by virus truthers that dont understand managed care reimbursement . As a senior level employee of one of largest healthcare providers in world, I work with this stuff every day.1 point
-
Even if mortality numbers are not much higher than the flu (and this might be very true), the total number of cases and total number of deaths from any case is significantly higher than previous years. So I think we are already beyond the point when people can claim "it's just the flu". I was in the same camp at some point, but you cannot argue with numbers.1 point
-
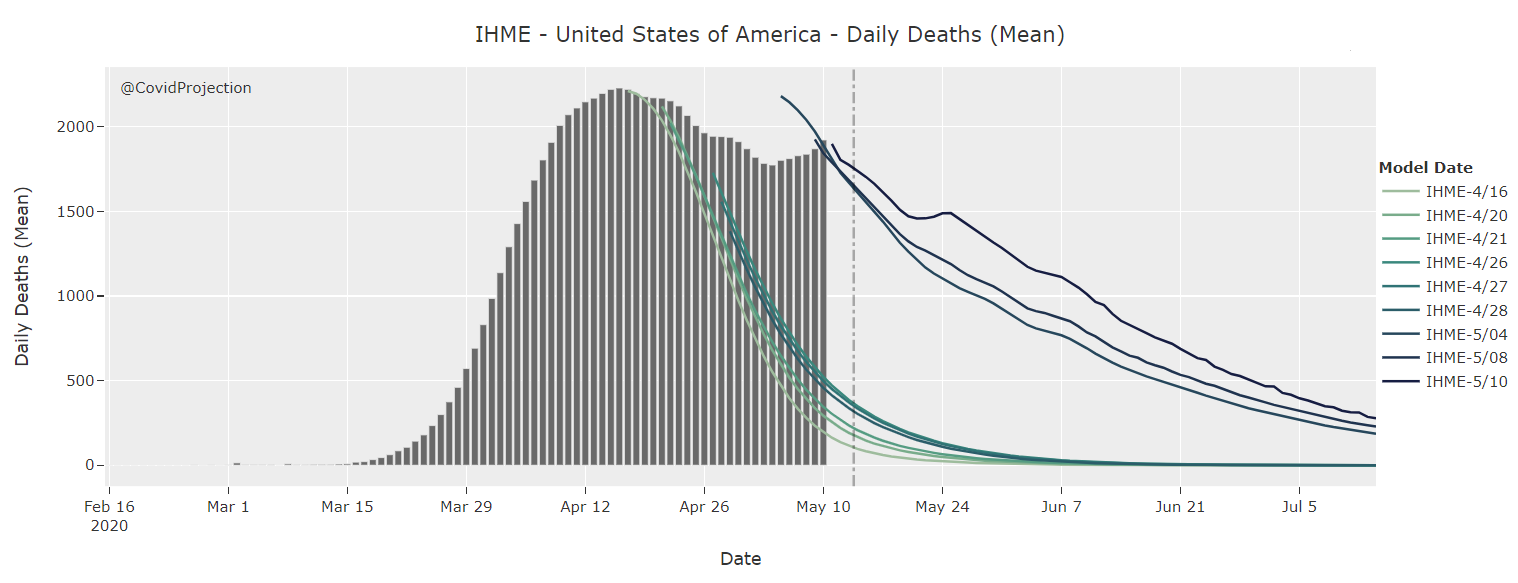
There is a canadian that did a website to track the earlier projections of the IHME model : https://www.covid-projections.com/ It seems that the IHME model was good to 'time the peak' but bad to extrapolate the decrease of death. You can see the projections from the end of april was not even matching the deaths per day. Some references : https://twitter.com/CT_Bergstrom/status/1250304069119275009?s=20 https://www.sportsnet.ca/hockey/nhl/hockey-analyst-helping-experts-fight-covid-19/
 1 point


This leaderboard is set to New York/GMT-04:00