Leaderboard


Popular Content
Showing content with the highest reputation on 04/15/20 in Posts
-
@dorgis87 What broker do you use? Most trading platforms such as TOS let you graph out option prices over time. If you are in the option chain in TOS you can right click on the bid or ask price and choose "send to red" and then if your chart is linked to red color it will graph that option's price over time. There are a few other ways to do it but I find that easiest.1 point
-
This topic was a little more active a while back and I had intended to give an update on my results at the 1 year mark, but I've been busy with other projects the last few months. My first CML trade was June 19, 2017, so it has now been almost 15 months and so far I still am only making trades posted on the blogs and by others. Anyway, here's my results to date using CML without actually having a subscription. I think it would be worth the subscription and will likely subscribe soon. Post-earnings Short Put Spread: 50 trades / +13.7% avg Post-earnings iron condors (mix of short and long): 25 trades / -19.4% avg Straddles (mix of pre- and post-earnings): 58 trades / +8.8% avg Pre-earnings Call: 202 trades / +3.0% avg TTM Squeeze: 10 trades / +48.5% avg Other: 10 trades / -36.6% avg --------------------------------------------------- Total Trades: 355 trades / +4.0% per trade avg (The results are not normalized, but I traded the closest I could to the same dollar amount per trade. Even so, some trades were 20% higher or lower than my trade amount, so that has some small effect. I haven't analyzed it to see if the effect helps or hurts the overall numbers versus being normalized)1 point
-
For me the jury is still out on CMLTradeMachine but more because I cant find something to research myself with it. I have followed their earnings momentum trades and participated on and off my record is below. I avoided most of the straddle trades because from the beginning these never made sense to me and paper trading them showed a loss despite their analysis. They have recently started coming up with other technical indicators and what not - I have not followed these as often-times I am not sure I get what the rationale behind the analysis is. This is probably more due to me than them but I avoid trading something I do not understand. During the process I also saw that as quite a chunk of money is on the table using the +40/-40% cutoff is smart. You may miss a few big winners but other winners turn to losers on the last day. The trades below are all real trades: Infosys Jan 8 OB 10 CJAN18 INFY 16 for 0.80$ Jan 10 CS 10 CJAN18 INFY 16 for 1.10$ Result: +0.30$/37.5% ASML Jan 12 OB 8 CJAN18 ASML 150 for 2.60 EURO Jan15 CS 8 C JAN18 ASML 150 for 4.00 EURO Result: +1.40 EURO/53.8% (I cant trace whether this was an earnings trade made at their advice or based on my own research but it was their earnings approach for sure) NFLX JAN 18 OB 8 C FEB18 NFLX 220 for 10.07$ JAN 22 CS 8 C FEB 18 NFLX 220 for 14.17$ Result: 4.10$ or 40.7% LRCX JAN 18 OB 8 C FEB18 LRCX 210 for 5.75$ JAN 24 CS 8 C FEB18 LRCX 210 for 8.30$ Result 2.55$ or 44.3% AAPL JAN 23 OB 8 C FEB18 180 AAPL for 3.20$ JAN 29 CS 8 C FEB18 180 AAPL for 4.25$ Result 1.05$ or 32.8% MSFT JAN 24 OB 20 C FEB18 92.50 MSFT for 1.99$ JAN 31 CS 20 C FEB18 92.50 MSFT for 3.72$ Result 1.71$ or 85.9% REGN - STRADDLE JAN 25 OB 4 FEB 18 392.50 REGN STRADDLE for 28.39$ JAN 29 CS 4 FEB 18 392.50 REGN STRADDLE for 28.40$ Result: 0 BA JAN 29 OB 10 C FEB18 BA 350 for 7.85$ JAN 30 CS 10 C FEB18 BA 350 for 5.45$ Result -2.40$ or -30.5% GOOGL - here I accidentally held through earnings JAN 30 OB 2 C FEB18 GOOGL 1180.20 for 37.30$ FEB 2 CS 2 C FEB18 GOOGL 1180.20 for 4.64$ Result -32.66$ or -87% AKAM - the position was losing money before earnings, I held through them thinking: how bad can it be? JAN 30 OB 8 C FEB18 AKAM 66.50 for 3.60$ FEB 8 CS 8 C FEB18 AKAM 66.50 for 0.20$ Result -3.40$ or -94.4% TEVA - STRADDLE FEB 1 OB 4 FEB 18 21 TEVA STRADDLE for 2.47$ FEB 7 CS 4 FEB 18 21 TEVA STRADDLE for 2.34$ Result - 0.13$ or -5.2% NVDA FEB 2 OB 8 FEB18 240 NVDA for 9.60$ FEB 12 CS 8 FEB18 240 NVDA for 5.33$ Result: 4.27$ or -44.4% ATVI FEB 5 OB 8 FEB18 70 ATVI for 3.10$ FEB 8 CS 8 FEB18 70 ATVI for 1.50$ Result: -1.60$ or -51.6% SQ FEB 14 OB 8 MAR18 43 SQ for 2.64$ FEB 23 CS 8 MAR18 43 SQ for 3.57$ Result: 0.97$ or 35.2% INTU FEB 20 OB 10 MAR18 180 INTU for 2.72$ FEB 23 CS 10 MAR18 180 INTU for 3.30$ Result 0.58$ or 21.3% PANW FEB 21 OB 8 C MAR18 170 PANW for 6.10$ FEB 26 CS 8 C MAR18 170 PANW for 7.40$ Result: 1.30$ or 21% ALRM FEB 22 OB 10 C MAR18 40 ALRM for 1.73$ FEB 27 CS 10 C MAR18 40 ALRM for 1.30$ Result: -0.43 or -24.8% COST FEB 28 OB 10 C MAR18 195 COST for 3.10$ MAR 3 CS 10 C MAR18 195 COST for 1.03$ Result: -2.07$ or -66.9% MU MAR 8 OB 10 C APR18 55 MU for 3.87$ MAR 21 CS 10 C APR18 55 MU for 6.40$Result: 2.53 or 65.3% LRCX APR 11 OB 8 C APR18 LRCX 200 for 8.25$ APR 17 CS 8 C APR18 LRCX 200 for 11.00$ Result 2.75$ or 33.3% NFLX APR 12 OB 5 C MAY18 NFLX 322.50 for 10.55$ APR 17 CS 5 C MAY18 NFLX 322.50 for 7.64 Result -2.91$ or -27.5% INTC APR 12 OB 10 C MAY18 INTC 52.50 for 2.37$ APR 26 CS 10 C MAY 18 INTC 52.50 for 1.77$ Result -0.60$ or 25.3% SPOT APR 13 OB 5 C MAY18 SPOT 150 for 10.08$ MAY 2 CS 5 C MAY18 SPOT 150 for 21.50$ Result: 11.42$ or 113.2% MSFT APR 20 OB 20 C MAY18 MSFT 95 for 2.45$ APR 26 CS 20 C MAY18 MSFT 95 for 1.81$ Result: -0.64$ or -26.1% EA MAY 3 OB 8 C MAY18 EA 118 for 4.55$ MAY 7 CS 8 C MAY18 EA 118 for 8.10$ Result: 3.55$ or 78% BZUN MAY 9 OB 10 C MAY18 BZUN for 2.30$ MAY 16 CS 10 C MAY18 BZUN for 1.24$ Result: -1.06$ or -46% AMAT MAY 10 OB 20 C MAY18 AMAT 55 for 1.40$ MAY 17 OB 20 C MAY18 AMAT 55 for 0.75$ Result: -0.65$ or -46.2% URBN STRADDLE MAY 17 OB 10 MAY18 URBN 44 STRADDLE FOR 2.46$ MAY 22 CS 10 MAY18 URBN 44 STRADDLE FOR 2.05$ Result: -0.41$ or -16% MOMO MAY 23 OB 15 C JUN18 MOMO 40 for 2.20$ MAY 27 CS 15 C JUN18 MOMO 40 for 4.55$ Result: 2.35$ or 100.6% MRVL MAY 24 OB 50 C JUN18 MRVL 22 for 0.85$ MAY 31 CS 50 C JUN18 MRVL 22 for 0.27$ Result: -0.58 or - 68.2% PANW MAY 25 OB 8 C JUN18 PANW 210 for 7.85$ MAY 30 CS 8 C JUN18 PANW 210 for 9.00$ Result: 1.15$ or 14.6% GWRE MAY 31 OB 40 C JUN18 GWRE 95 for 2.50$ JUN 5 CS 40 C JUN18 GWRE 95 for 2.35$ Result: -0.15$ or -6% RH JUN 5 OB 8 C JUN18 RH 107 for 7.00$ JUN 7 CS 8 C JUN18 RH 107 for 10.00$ Result: 3$ or 42.8% MU - I was delayed in a plane and missed the possibility to close ahead of earnings JUN 13 OB 10 C JUL18 MU 60 for 4.40$ JUN 25 CS 10 C JUL18 MU 60 for 0.64$Result: -3.76$ or -85.4% NFLX JUL 2 OB 3 C JUL18 NFLX 400 for 18.99$ JUL 9 CS 3 C JUL18 NFLX 400 for 27.38$ Result: 8.39$ or 44.1% GOOGL JUL 2 OB 2 C JUL18 GOOGL 1150 for 27.50$ JUL 12 CS C JUL18 GOOGL 1150 for 57.50$ Result: 30$ or 109% JNJ JUL9 OB 20 C JUL18 JNJ 128 for 0.94$ JUL12 CS 20 C JUL18 JNJ 128 for 1.37$ Result: 0.43 or 45.7% INFOSYS JUL9 OB 20 C JUL18 INFOSYS 20 for 0.55$ JUL13 CS 20 C JUL18 INFOSYS 20 for 0.37$ Result:- 0.18$ or -32.7% MSFT JUL 12 OB 20 C JUL18 MSFT 105 for 1.24$ JUL 13 CS 20 C JUL18 MSFT 105 for 1.93$ Result: 0.69$ or 55.6% Net for these trades before Commissions was 18,709$ Ok Am tired of going through all the trades there is half a dozen more : a disaster with NFLX due to a dinner running late and a few duds along the way; most recently NVDA was but BABA a star- you get the idea. Active management of the positions is required - several of the best results are the consequence of profit taking plain and simple when I found the numbers to be dizzyingly attractive. The results aren't bad however I remain sort of wondering whether this isn't simply a normal tendency of stocks to rise somewhat close to earnings and gain in volatility which makes the options dearer. I have ignored their new ideas for the moment and still need to figure out how to institutionalise use the positive results above and avoid some of the losers. Admittedly the biggest ones were mainly my own fault!1 point
-
Here is an example of how I have used CML as an adjunct to the SO calendar trades, pre earnings. We know that those calendars , on their own, are very good trades, with a great success rate. We also know how, if you wait for the "official" alert to come out, more often then not, the price jumps and you either miss the trade entirely, or have to wait a few days, if you are lucky. Sometimes they jump a huge amount right away. So, I added the CML concept of price having a run up in the period approaching earnings, and if it backtested well in this area, I would put on less expensive (RV) calendars, which were a few strikes above where the price currently was, and where the "official " trade strike was. I have found that this has worked far more often, for me, than not. This is a way of not using CML entirely for a trade, but using an aspect of it, to add to the overall mix of an SO trade. Just a recent example would be NTES, where the official trade was around the $245 strike. I put on $265 and $270, and the price was $268 the last 3 days before earnings.1 point
-
Having completed a 100 CML trades, I thought I would summarise my results. Summary : 100 trades, 66 winners, overall profit of 12.1% PER TRADE. Here is a detailed breakdown, with further comments. Cons : I am cautious that most of the trades were done during the bull market phase and as a large number were long calls (65%), this meant I already had a helpful backwind pushing my trades/profitability upwards. There is heavy reliance on pre-earnings (70% of trades), and ideally, I would like to do more post-earnings too; or index/VIX based trades where earnings are a non-issue. Some of the CML test data has very obvious errors. I always checked the individual results of the backtests before I went ahead with a trade. The smaller/less-known stocks with low options liquidity tend to be more prone to data errors. It can feel a little like a roulette table - which may not necessarily be a bad thing if we are the casino owner with the edge in our favour. So far, I feel more like a sharp-suited, cigar-smoking casino owner, rather than a Joe punter. But this could be due to the first point above, about being in a bull phase. Pros : There was very little or no trade management involved - it was almost a set-and-forget type operation, where I would open a trade, put in my profit target and let the position close itself. This is a very strong benefit, as it makes for a mechanical approach, which is great esp for those with limited time. Very little time investment needed (related to above). Very easy to enter trades - whilst (and this is not a criticism at all) some SO trades can be frustrating to enter due to our strict price limits, my CML trades were opened at the mid price most of the time - within seconds/minutes of me putting my order in. I didn't even try to enter at lower prices than the current, because as the profit/loss amounts are much higher, say 40% either way, so paying a few cents more for a long call on CML didn't bother me too much. Very scalable, so definitely suitable for large portfolios. Tons of trades available. Short average trade holding times - 4.1 days - and this would have been much shorter if there were no short IC post-earnings trades, which tend to have long holding times. Other : Trades were opened in the last hour of the day that the CML tests suggested. I started in Nov '17 and was very active with CML during Dec/Jan, but did hardly any trades in Feb. My closing was based on around 40-50% profit, or sometimes, I would not put in a closing GTC order and close when the trade hit these levels or higher. I traded with very low allocations, and even then I've made enough money to pay for years of subscription fees for CML. I will now formalise/structure my CML trades more and will create a separate portfolio for this. I am under no illusions that a 12.1% return per trade is not realistic in a non-bull market environment, but even a 5% return would result in a very healthy cumulative annual profit.
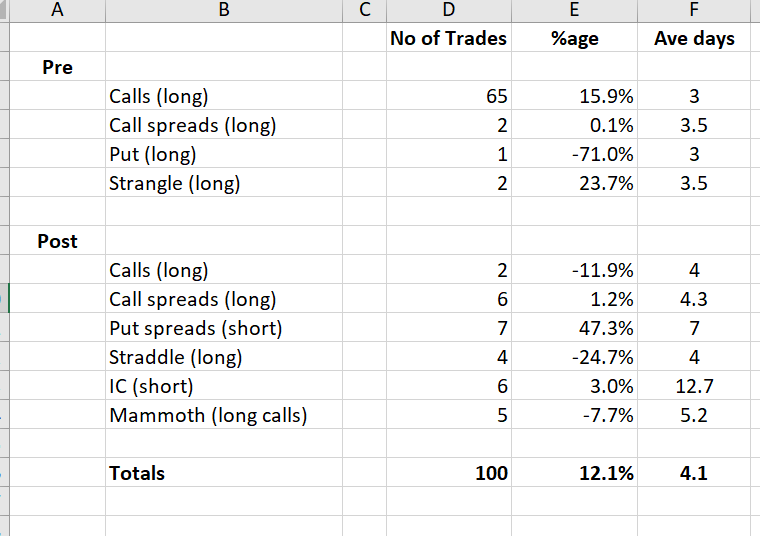 1 point


This leaderboard is set to New York/GMT-04:00