Leaderboard


Popular Content
Showing content with the highest reputation on 06/29/19 in Posts
-
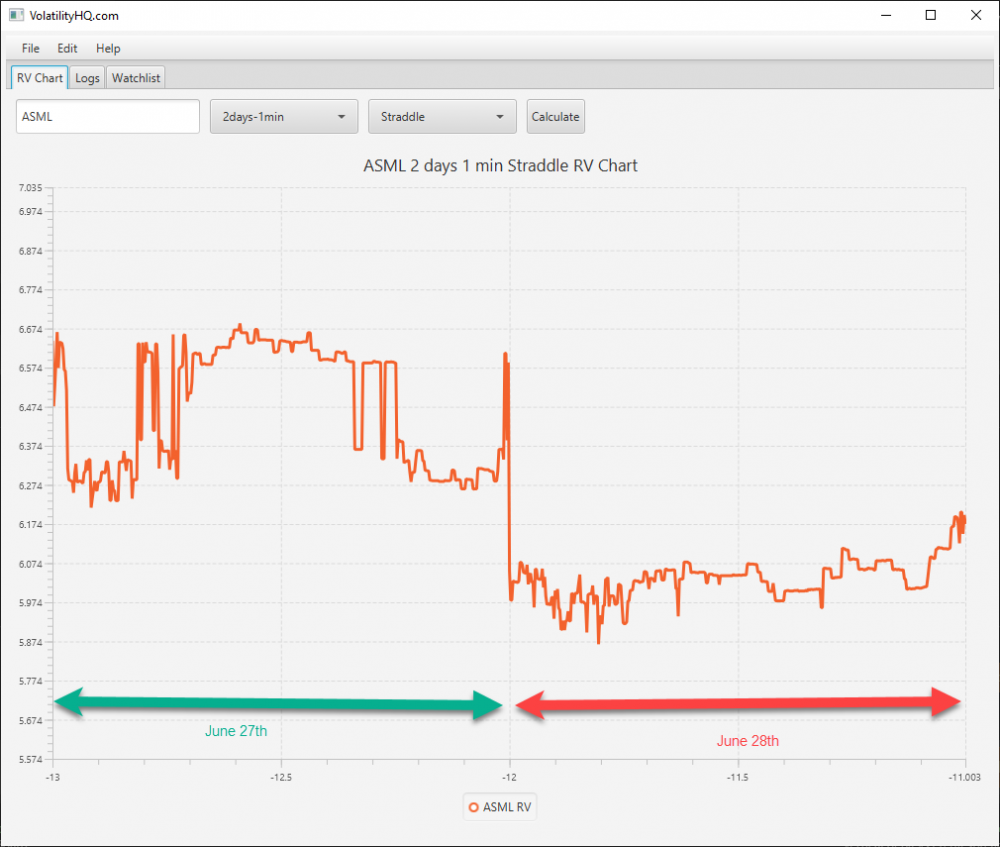
@Javier Here is the fixed ASML x-axis. My goal for the x-axis in the desktop app is to replicate the same x-axis found in the RV charts on the website, so that it's easier to compare. See the green arrow for the trading session of June 27th, and the red arrow for the trading session of June 26th. Also note that from the IB TWS api, you don't get the last close of 16:00, so if you look at a 1 min chart, the last available point from the api is 15:59. A little bit silly but it seems a limitation of the api.
 1 point
 -
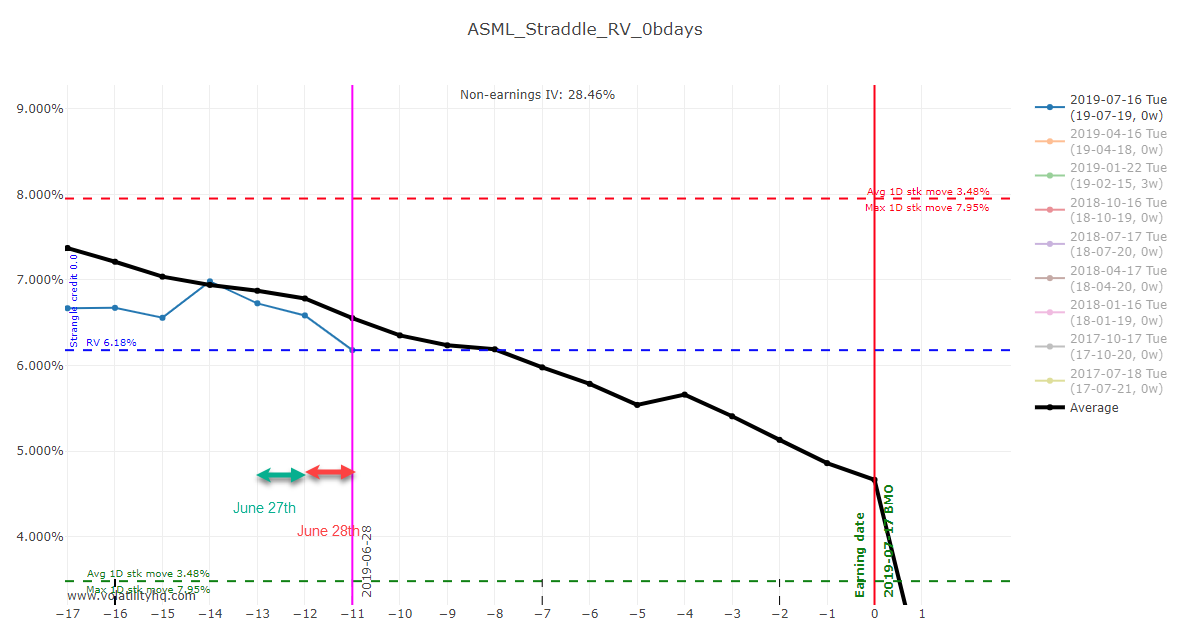
Yes it's supposed to be the number of trading days before the earning date. It's fractional so that -9.5 is the middle of the day for example. -9.9 is near the open for that day, and -9.01 is near the close. Right now, there is a bug in the counting of the number of days for the x-axis to exclude the weekends and the holiday (the 4th of july), but your chart ASML shows the straddle RV for ASML for June 28th (today), and -9.987 is the open for today, and -9.01 is the close for today. The number 9 is wrong and off by a few days, but you get the idea.1 point
-
X-axis looks to be days to earnings, so you see the fractional amount during the day and the whole number 9 at the close (I think @Djtux said it was off by 1 day, hence the 9 instead of 10).1 point

This leaderboard is set to New York/GMT-04:00