Leaderboard


Popular Content
Showing content with the highest reputation on 08/22/17 in Posts
-
In my opinion for a SAAS (software as a service) like https://www.volatilityhq.com, there are 3 things in order of priority (sorry if it's too technical) : Uptime, performance, and up-to-date data : now that i launched the website officially, it leaves me more time to focus on things like performance : transition from in-memory cache on each server to some cache like Redis or Memcache (AWS Elasticache). Uptime is important as you don't want the service down, especially now that i charge members, so i have a plan to do things in the backend to provide higher-availability. Up-to-date data : i also need to take care of the data each day, even if it's automated, i feel i can improve that. Bug fixes : self-explanatory, if there are bugs, i need to fix that first New features : i have many features in mind to improve the service even more, but i'm interested to know what would be useful from the members. That would help guide the effort. I also have to keep in mind that there are some quick wins as well that is not too hard to code but provide business value. As for an exact list of enhancements, i was thinking about implementing a vote+comment system on the website to get feedbacks on what's important. But for some possible enhancements (keep in mind i might be talking about multi months development projects) : Earnings calendar / scanner : that could include a way to more easily see if a strategy is cheap or not (https://steadyoptions.com/forums/forum/topic/3724-may-22-26-2017-trading-candidates/?do=findComment&comment=72791) like an RV rank metric. That way, you have a table with each row being a ticker, and in columns you would get an RV rank today, and an RV rank between the RV today and the average at T=0 for example. From the table, you could see which ticker to focus the analysis, and check the RV chart like now. That's a big project technically, because i need to setup some worker servers to be able to process many tickers in the background. Export csv data from the chart (https://steadyoptions.com/forums/forum/topic/3769-discussion-unofficial-trade-ideas/?do=findComment&comment=78849) Make the website mobile friendly Be able to change the number of cycles and be able to go further back in time (let's say backtest the last 2 or 3 years) Handle the case when earning date is uncertain Handle the straddle/strangle strategy : i'm not completely satisfied with the RV charts to access if a stock is a good candidate for a straddle+strangle strategy. There is some research to do on how to analyze a stock to see if it's a candidate or not. If you guys have ideas on how to do that... Use intraday data to compute the RV charts : maybe something like 30 min or 60 min intraday : that's about 6 to 13 points per day. That also means that 6 to 13 times the size to store the data in database. And the data is not cheap. But i really want to do that at some point. The list is not exhaustive.1 point
-
I think if you have a 100K+ account, then tradier is the best choice unless you are a gunslinger with position size.1 point
-
There is a discussion somewhere in Brokers and Commissions thread, TW commissions are on the same level as IB commissions, maybe slightly lower, but not enough lower to justify moving to TW for most of the members. And TW and Tradier use the same clearing firm to route orders and trades for them, so TW cann't be faster than Tradier.1 point
-
Sorry for the delay in getting back to you, been on family vacation. Minimal activity required. Trend has the full risk profile, but it's better than ONE (for my purposes) in that you can adjust the spread (and target fills) before 'committing' the order to see how it affects the position. When you like it, you right-click, open trade window, set your limit order, and it's done. If/When filled, it's then added to your 'position monitor'. Here is the risk graph + features I have in Trend (with one exception - there is no 'compare spreads' button): https://www.dynamictrend.com/feature_riskgraph/ Regarding portfolio view, they do not show P/L of Margin. Only P/L of each leg. That said, you can select any number of legs, and show the current risk graph with a couple clicks. Attached is a scrubbed view of one of my accounts. You can maximize any of the views to get a more full view. It's not wonderful, but it is more effective than IB's for me. Hope that helps.
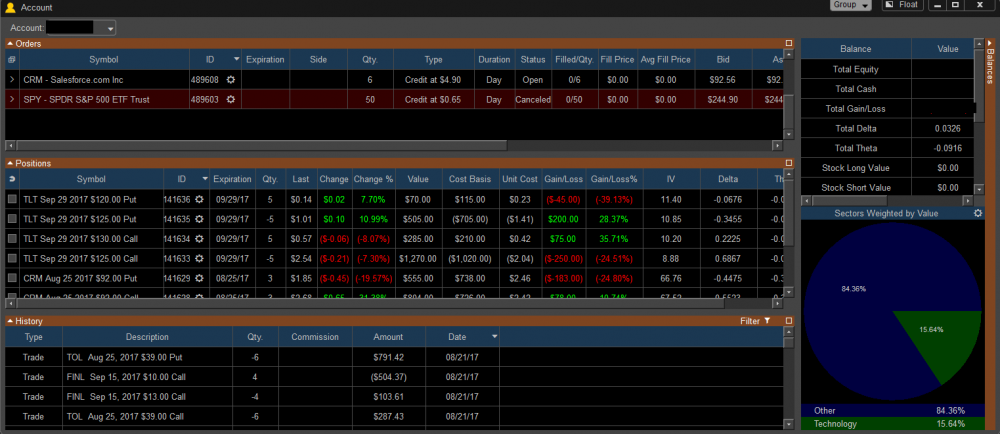 1 point


This leaderboard is set to New York/GMT-04:00