Leaderboard


Popular Content
Showing content with the highest reputation on 08/08/13 in Posts
-
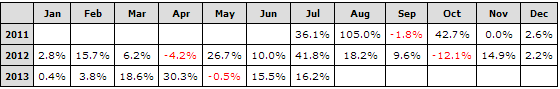
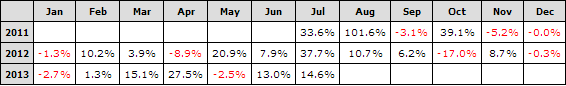
We are asked many times how SteadyOptions performance is calculated. The purpose of this article is to clarify few basic terms and explain how we calculate and present our performance. ROI (Return On Investment) vs. Portfolio Return First, lets explain the difference between ROI (Return On Investment) and Portfolio Return. Lets take as example a month where we had 20 trades with average return of 5% per trade (this example is not far from our average performance). Lets also assume that we have a $10,000 portfolio, allocate 10% ($1,000) per trade and have maximum of 6 open trades. The total return for that month would be $50 (return per trade) * 20 (number of trades) = $1,000. Since we have maximum of 6 open trades, our investment is $6,000, so our ROI would be 1,000 / 6,000 = 16.7%. However, Portfolio Return is 10% since the total size of the portfolio is $10,000. ROI will always be higher than Portfolio Return since we keep portion of our funds in cash. If we increase the allocation to 15% per trade, our return per trade will increase to $75, total investment to $9,000, total return to $1,500. The ROI will remain the same (16.7%), but the Portfolio Return will increase to 15%. This is an important point: the ROI will always remain the same, but the Portfolio Return will vary, depending on the allocation. Compounding vs. non-compounding Next thing to clarify is compounding vs. non-compounding. Non-compounding means that we allocate a constant amount of money to each trade. In case of 10k portfolio and 10% allocation, that would be $1,000. Compounding means that as our account grows, we increase our dollar allocation to match the new portfolio size. For example, if we made 10% on our first $1,000 trade, portfolio value is now $10,100 and we will allocate $1,010 to the next trade instead of $1,000. Compounding will have a significant effect on portfolio returns. Our model portfolio uses 10% per trade allocation and compounding, while our ROI is non-compounded. This is actually pretty conservative since it leaves at least 40% of our funds in cash. Pro-Trading-Profits reports As you know, our performance is verified by Pro-Trading-Profits, an independent website tracking the strategies of trading newsletters and advisories. The report was generated using the default PTP allocation which is 15% per trade and zero commissions. We present this report ex-commissions to make it comparable to other services which present performance data ex-commissions as well. Lets see some examples to demonstrate how performance is affected by different parameters. If you go to the "Monthly Returns" tab, you will see the following table: This table might look familiar to you - it appears on our Performance page and is taken directly from the PTP report. Now lets see what happens when we use commission structure of $0.75 per contract and no base rate (which is what I pay at Interactive Brokers): As you can see, the impact of commissions is about 2-3% per month on the whole portfolio. In some months it was higher because we traded more, but with 15-20 trades per month, 2-3% per month would be pretty typical, assuming $0.75 per contract. It also seems that in 2013 PTP changed the way they calculate commissions, so you might see higher impact in 2012, but 2013 gives better representation of impact of commissions. You can change the commissions structure and see the results. You can also play with different allocations and see how that would affect performance. I hope this article helps to clarify some misunderstandings about performance reporting. Let me know if you have any questions. Comment: Pro-Trading-Profits closed a while ago, after tracking our performance for 3 years.
 1 point
 -
Awesome post Mikael thanks for sharing. I want to read all of Augen's books and it drives me crazy not having the time ... PaulCao I'll take a stab at the math question: It looks like what this is doing is converting a population stdev to a sample stdev. When you calculate the stdev of a population you take the sum of the squared differences from the mean, divide by "length", and take the square root. However, if you are inferring the population stdev from a sample, you have to divide by "length - 1" to get an "unbiased estimator" of the population stdev. The reason for this is to adjust for a fairly esoteric mathematical concept known as the "degree of freedom" taken up by using the sample mean as an estimator for the population mean before computing the sample stdev. I did a google on ToS's stdev function and it does appear to be using the population version, so this adjustment appears to be correct. Here's a link to the formula for the ToS version: http://demo.thinkorswim.com/manual/dark/thinkscript/reference/Functions/Statistical/StDev.html. Note that in Excel, the "default" stdev function is the sample version, and you have to use stdevp to get the population version.1 point
-
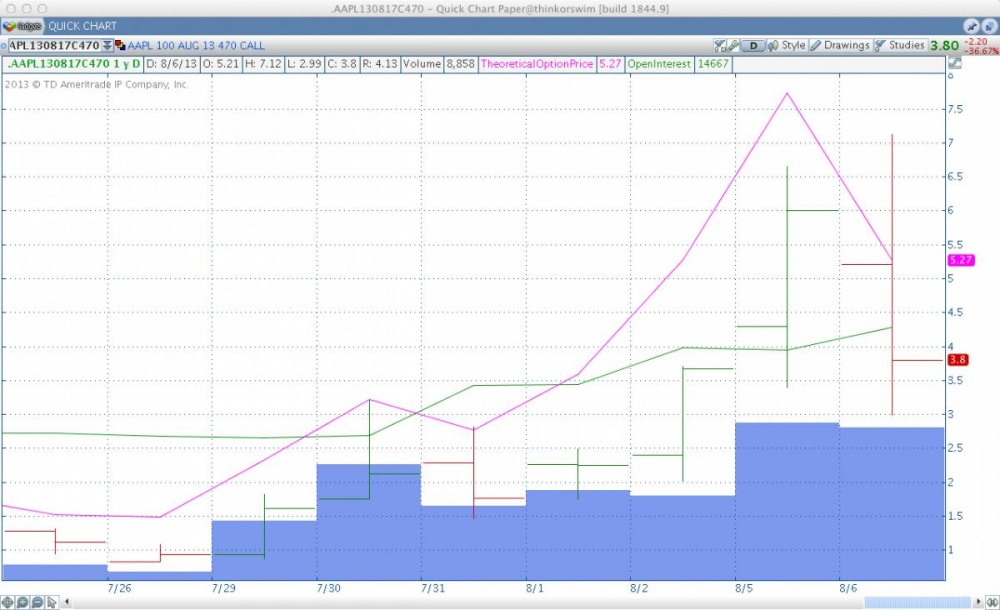
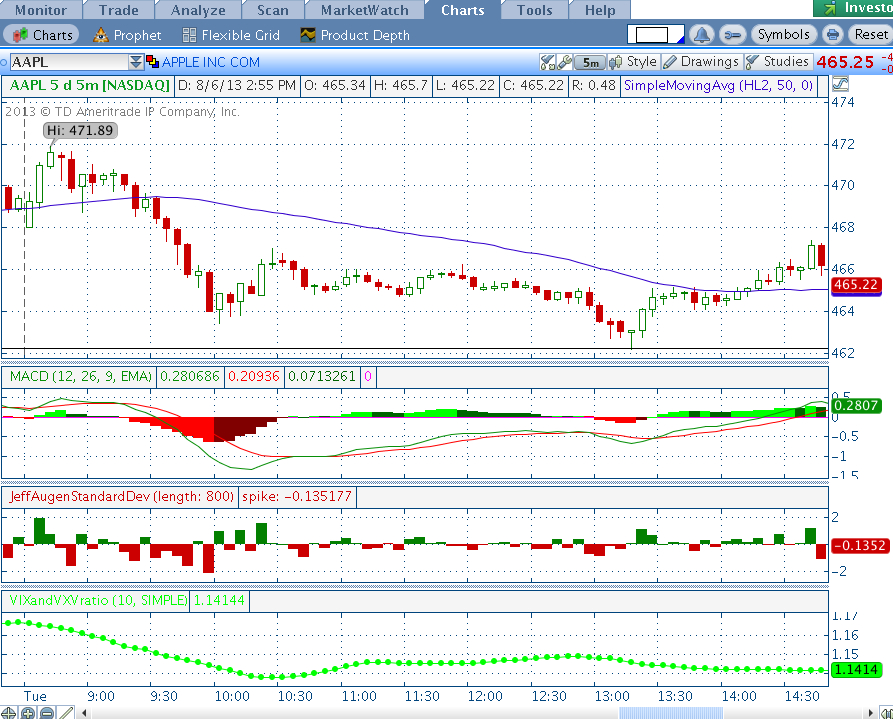
Hi Red, i haven't read that book yet but i did read his the volatility edge in options trading. (he actually discuss pre-earnings straddles/strangles which is also relevant to SO trades). he also discussed about the trading options on expiration day in this book. not sure if he talked about the samething in TOAE, but i suspect it might be similar. basically, options lose the most value on the thursday evening and expiration friday. and many stocks exhibit a "pinning" effect on Friday. (he said it's because of institutional traders unwinding large complex positions or something), anyway not too sure of the exact reasoning behind it but he gave an example using google and said basically stocks tend to exhibit a pinning effect on the higher option strike on expiration fridays. (so for ex. if goog is trading at 912 friday morning, it is likely to trade at around 915 for the entire day.) so in this case, he's saying on friday it's good to short the expiring option to extract the last remaining value in it. so you'd short a OTM option on this day. Obviously if the IV is higher the more premium you are going to get so this strat would work better in the high IV environment, but i think it would still work in low IV environment you just won't get alot of premium. the std bar thing is just the way he looks at price spikes and he describes a system to use it as an entry and exit signal. i think this kind of signal can work in any market type. the basic premise is since options are priced according to STD of the underlying price, whenever your underlying spikes up or down (2+ STD) you should use it as a entry or exit signal. most short term price ticks tend to be mean reverting, if you have an especially large down or up tick, it should revert back to the mean price. (not always but that's the idea). 2STD is quite a big spike (think about it, if the prices are normally distributed a 2 std spike only should happen about 4.5% of the times). obviously most stock prices are not normally distributed. the point is that is a pretty big up down tick and you can take advantage of the mean reverting trend. (you also need to assess not only based on this study but your other technical indicators, like MACD RSI etc.) since you have to pick a direction otherwise you can't use the spikes as signal. the downside is it's very hard to guess medium to long term direction, and i'm usually wrong on market predictions so i'm kinda of adapting this system to be way shorter term. thus using the 5m charts and trying to close trades within 1-3 days and keep position size small). btw this system is very directional so it's not at all similar to the SO strategies. it's basically the same thing as trading stocks. if you have a big account you can use 1.0 delta options, but for expensive stocks that's too expensive for me so i'm using 30 delta otm options instead. as a example i have been using AAPL aug 17 470 call option. you can see the price of the contract ranged to 3 - 7 today. that's a huge latitude you have to work with. then look at the jeff augen study. the entry signal would be the down tick around 10 today. it was more than 2 std downtick. your exit signal is up to you. you can take profit at a certain p/l% or exit at 1 STD deviation uptick around 3:40.
 1 point


This leaderboard is set to New York/GMT-04:00