Leaderboard


Popular Content
Showing content with the highest reputation on 07/24/13 in Posts
-
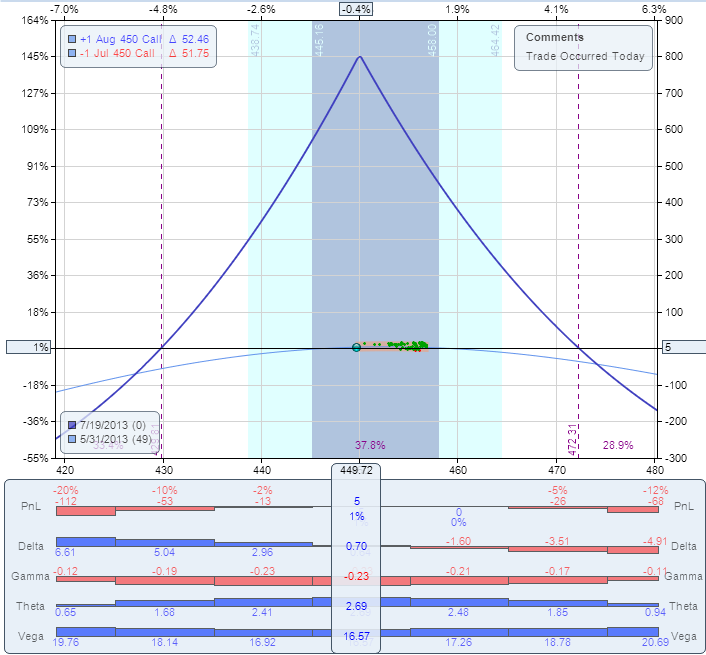
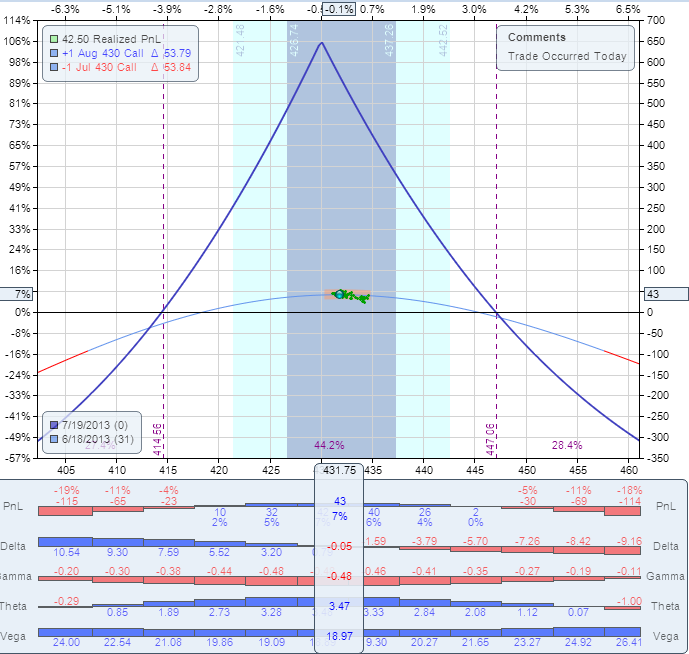
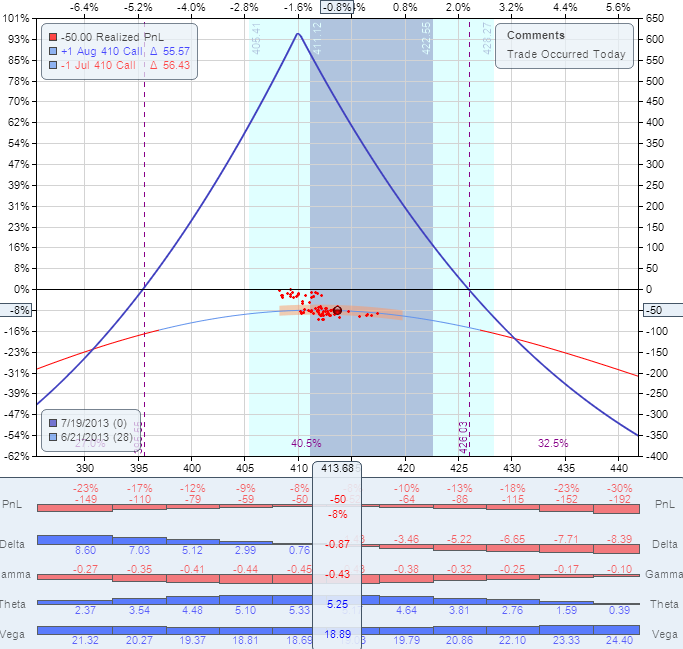
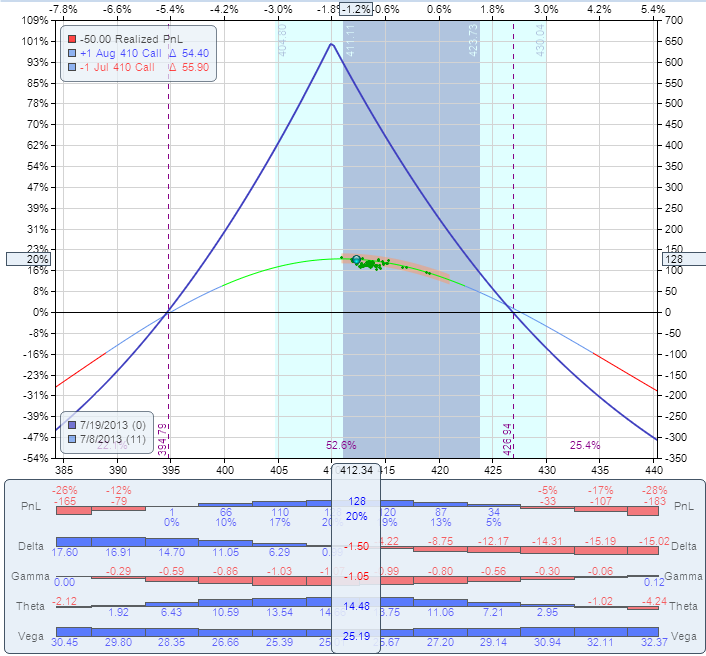
I usually don't do post-mortem on our trades - most of them are short term, we are in the trade just few days, close them and move on. However, this trade is worth to do a post-mortem so we all can learn from it. Background: When we trade a calendar spread, we have two Greeks working for us: the Theta (time decay) and the Vega (IV). We have one Greek working against us: the Gamma (stock movement). The trade makes money if the stock stays in the range and IV does not decline. It can lose if the stock moves, but even if the stock doesn't move, IV decline can kill the trade. The AAPL trade was opened on May 31 and structured in the following way: Buy to open AAPL August 16 2013 450 call Sell to open AAPL July 19 450 call Price: $5.50 debit. The P/L chart looked like this: Since AAPL is scheduled to report earnings on July 23, the long options expire after earnings and they were expected to hold value. The IV of August options was around 27% which is pretty low. It was expected to rise as we get closer to earnings. Fast forward to June 18. The stock is trading slightly below 430. The trade was up ~6% at this point. This is our adjustment point. The correct action was to roll the trade to 430 strike, by selling the 450 calendar and buying the 430 calendar, same expiration. The roll would cost $0.75. The new P/L chart would look like this: Fast forward to June 21. The stock is trading around 413. The trade was down ~8% at this point. This is our second adjustment point. The correct action was to roll the trade to 410 strike, by selling the 430 calendar and buying the 410 calendar, same expiration. The roll would cost $0.30. The new P/L chart would look like this: The stock continued drifting lower, but it did not reach the next adjustment point. After briefly going below $400, it reversed and came back to $412 on July 8 and could be closed for 20% gain: Why didn't we do it and what can be learned here? When the stock reached $425, I estimated that it is oversold and is not going much lower. The IV of August options was still at very low levels. I expected it to start rising as we get closer to earnings. The IV rise would at least partially offset the gamma losses. It did not happen. In fact, today the IV of August options is still around 29% which never happened. The IV of the monthly options before earnings was never below 35%, usually closer to 40%. To add insult to injury, when the stock reached $410, I added a "hedge" by opening a short term 410 calendar. This calendar has lost another $0.60, adding to the overall loss. It also increased the overall investment by almost 40%. This was throwing good money after bad. After the stock recovered to $430, I had a chance to close it for breakeven, but I left it open - again, due to the expectation that IV of the August options just cannot remain that low. The trade was finally closed today for 35% loss. Few things contributed to the big loss: 1. The stock moved more than 50 points at some point which is almost 2 SD (Standard Deviations). 2. The IV of the long options was almost unchanged before earnings which is extremely unusual. 3. The "hedge" added to the loss". 4. The trade was not adjusted in time. Expecting the IV to rise was a reasonable expectation. It did not happen, but there was a high probability that it will. We trade probabilities. There is a big difference between probability and certainty. There was a high probability that IV will not stay that low, based on historical patterns. However, high probability is still not certainty, and IV did not rise as I expected. When something happens few cycles in a row, we have a reasonable expectation that it will happen again. We trade based on those expectations, but we know that patterns not always repeat. In this trade, the main mistake was not expecting the IV rise - the main mistake was not to adjust when the price got to the adjustment point. The trade was actually up 12% after few days, and some members closed it for a gain. My original profit target was 20-25%. I don't think it was a mistake not to take profits at 12%. While there is nothing wrong to set a 10% target on those trades, I like to set higher profit targets, based on my experience with those trades. The bottom line is that despite the unfavorable conditions, with proper management we could still make 15-20% on this trade. The main lesson from this trade: When trading non-directional strategies, never let your opinion affect the trade. Always follow the rules, adjust in time, no matter how oversold or overbought the stock looks.
 3 points
 -
for those who trade VIX - be it though futures, options or ETP's (VXX,XIV,ZIV and the like). I came across a paper that I found very interesting - well I only glanced over it for now and read a few things in more detail, but it looks very interesting so far. Trading VIX related strategies is slightly more complicated in my opinion that 'normal' option strategies, so if you are new to options and still get your head around delta,gamma,theta keep this for later and certainly venture into this area slowly and carefully. Having said this I think this is written not overly complicated and you don't need a degree in maths to understand it. It also offers a number (5 to be precise) of actual trading strategies and compares them - so it's not only about theory. At the first glance I particularly like these two (for simplicity and results): #3-Roll Yield: if the 10 day moving average of VXV/VIX > 1 go long XIV else go long VXX #4-VRP: (volatility risk premium) if the 5 day moving average of (VIX - 10 day historical volatility) > 0 go long XIV else go long VXX I have heard of the first one before here (note this guy has the ratio the other way around). The results looks pretty good however I would caution that these reverse ETN's havent been around for too long yet (~2.5-3 yrs - so after the 2008 financial crisis) and trend in VIX was down over that time frame so a simply buy and hold would have been a pretty good investment as well. So the backtesting has to be seen in that context. A quick backtest since 30-Nov-10 (when XIV was listed) and I start with a long position in XIV on both: roll yield: 7(!) trades since inception, total (non compounded return (just adding % returns so +12%, +13%, -5% = +20%) = 296% (the strategy is long XIV since 12-Oct-11 without any trades since) VRP: 23 trades since inception, total return 153% buy and hold XIV since inception (30-Nov-10) 146% NB: I'm counting a flip from one ETN into the other as one trade. Backtesting has been done with EOD prices. I urge you to understand how VXX and XIV work and the risks involved before you actually try and trade this. Also read the paper (they mark the bits about risk with a 'grim reaper' ) okay here the paper and the link to the back testing sheet (let me know if you come across any errors). Marco. 00R_Easy Volatility Investing + Abstract - Tony Cooper.pdf https://dl.dropboxusercontent.com/u/26062189/XIV_VXX_strategies.xlsx1 point


This leaderboard is set to New York/GMT-04:00