All Activity
- Today
-
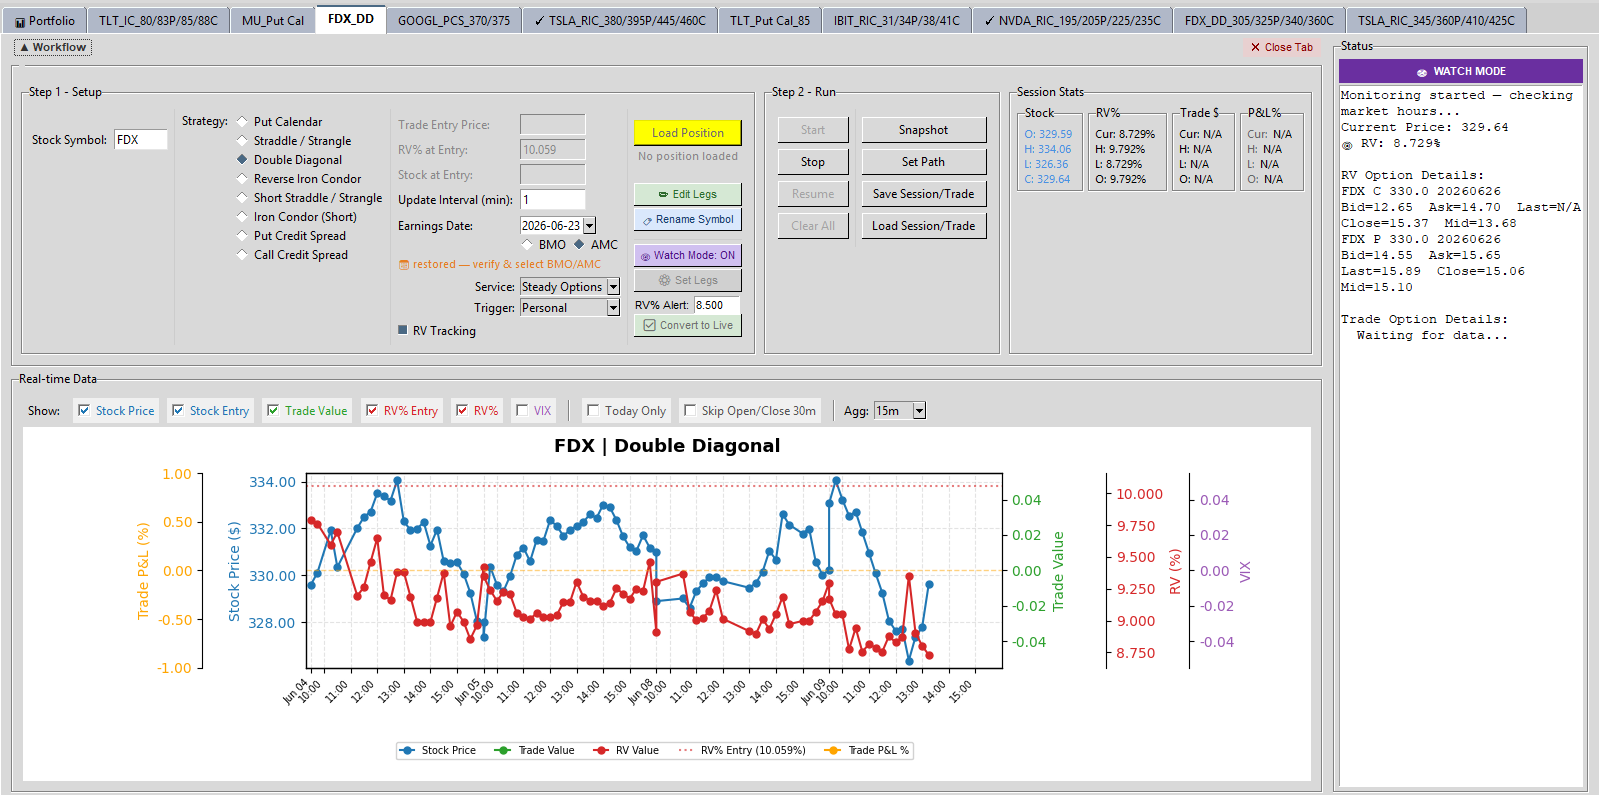
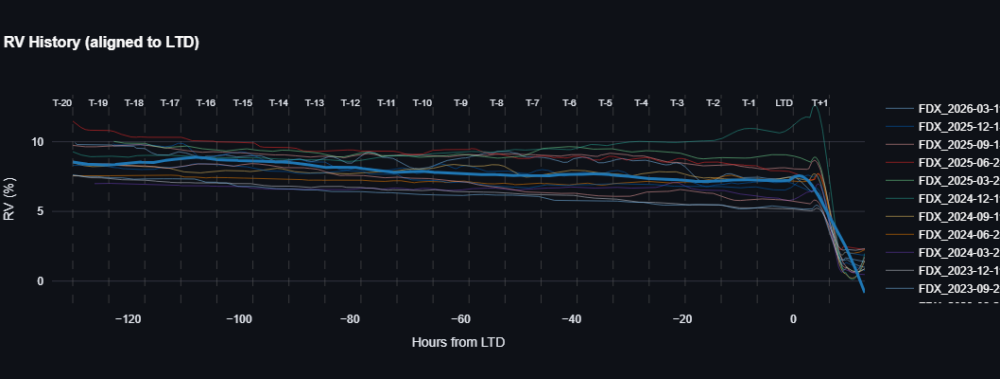
@krisbee thanks for that note ... I have been able to track it with the code @Bhavan1986 and I worked on and went with a DD when RV% went below 9 this morning

-
FDX is because they split the company to FDXF and stopped options data for FDX (atleast for now).
- 1137 replies
-
- 1
-

-
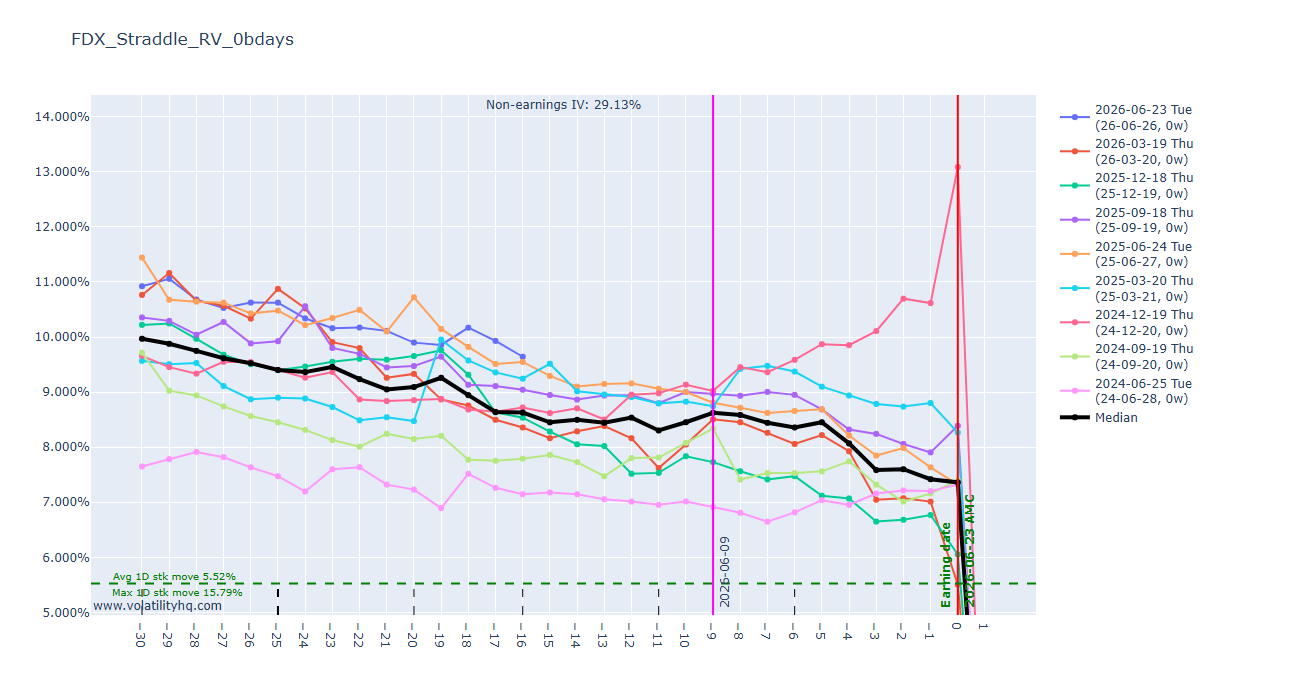
- rv chart
- volatilityhq.com
- (and 1 more)
-
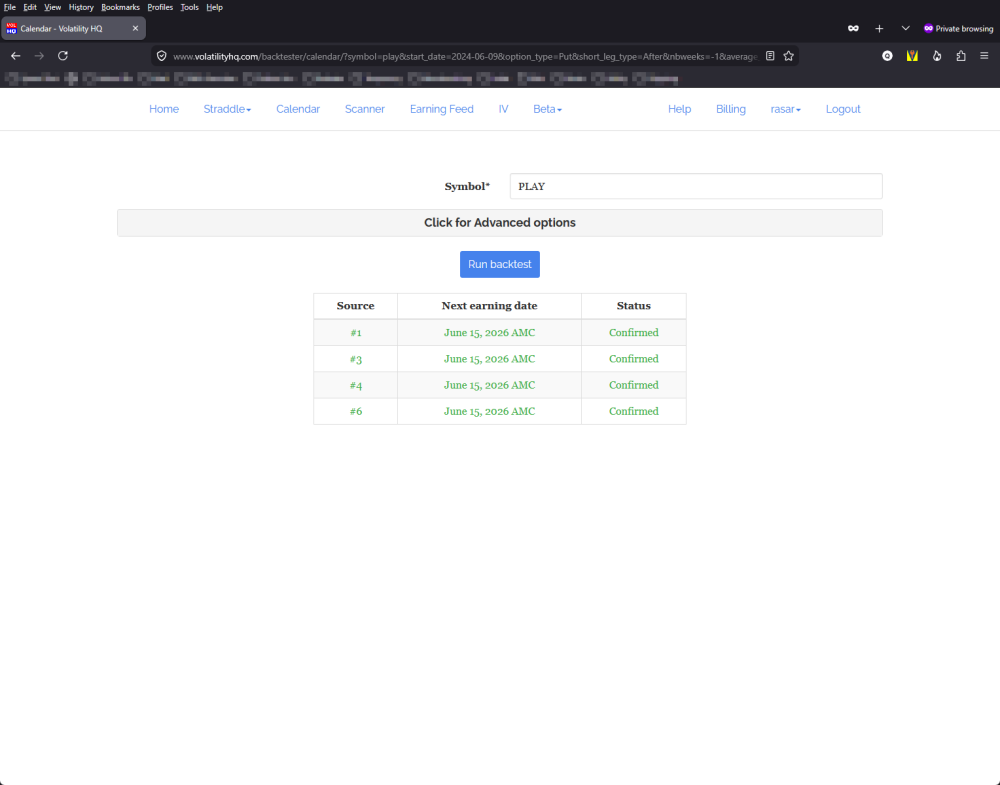
Seems to be across the board. I tried TSLA, PLAY and FDX, both Straddles and Calendars. I also tried it on MS Edge with the same result.
-
Maybe this chart will help
- 1137 replies
-
- 1
-
-
- rv chart
- volatilityhq.com
- (and 1 more)
-
It seems only FDX has stale data for some reason. I see the same chart as @Canuck_Dave. @rasar is it just for FDX that you have a blank screen ?
-
At least you got a chart. Mine doesn't plot anything - just a blank screen. The Tables work fine, just not the charts. I wonder if you're getting the cached version. @Djtux - Looks like you may have a problem with plot.ly... I think.
-
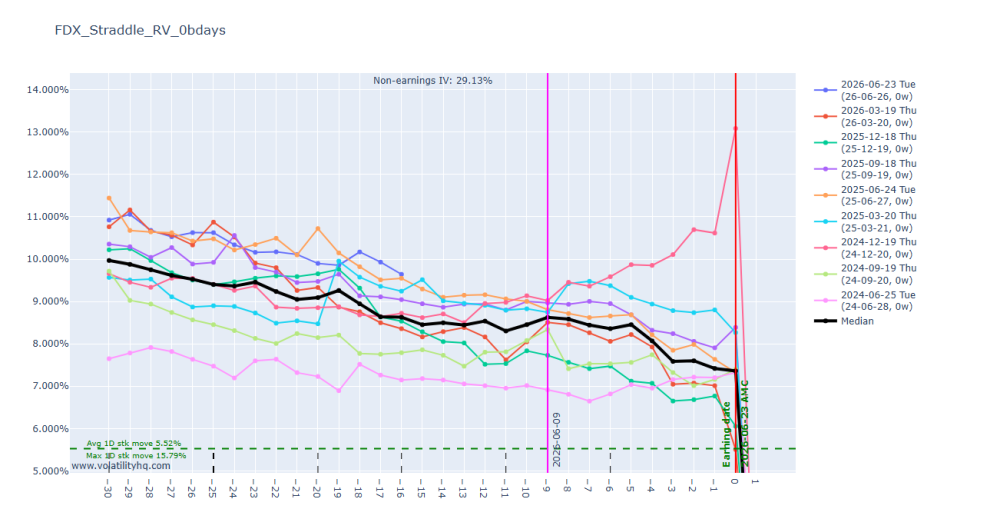
@Djtux something off witht the FDX straddle chart hasn't plotted a value for past several day
-
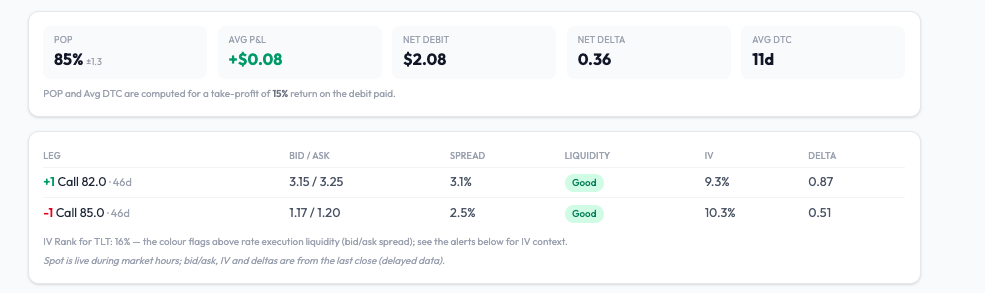
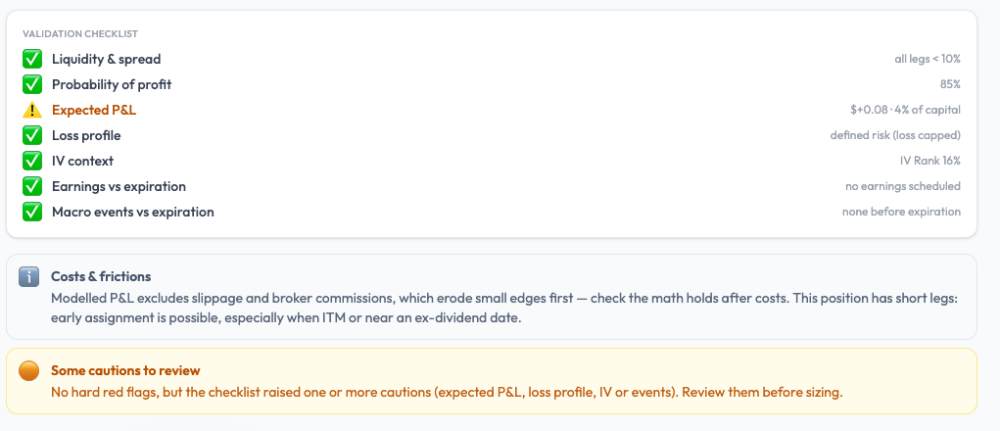
 An 85% win rate. Would you take this trade? Here's a setup that came up on TLT this week — the kind that looks like the sensible, high-probability play. A bull call spread, built defensively: buy the 82 call (deep in the money, delta 0.87), sell the 85 call (at the money, delta 0.51), 46 days out. Spot is sitting right at $85, your breakeven is down at $84.08, so you're already through breakeven before the trade does anything. This image is from the Trade Doctor of my upcoming website https://app.optionbench.com/ After clicking on "Analysis, doctor!", here are the resuts (a few seconds later): The simulation gives it an 85% probability of profit. Eighty-five percent. Deep in the money. Breakeven already behind you. Would you take it? I almost did. Then I ran it through the diagnostic I've been building, and it asked three questions the win rate doesn't. Question 1 — What's the payoff? The spread costs $2.08. Its maximum win is $92. Its maximum loss is $208. Read that again. You're risking $208 to make, at best, $92 — you can lose more than twice what you can win. And it gets tighter, because the plan is to take profit at +15%, which on a $2.08 debit is about $31. So the reward you're actually reaching for is roughly $31, against $208 at risk. That's the deal hiding behind "85%": win small, win often, and when you lose, lose several times the size of a win. Question 2 — What's the expectancy? Run the Monte Carlo and the average P&L comes out at +$0.08 per share — about 4% of the capital at risk, over an average holding period of eleven days. It's positive, which matters. But it's thin. You're committing $208 of capital to harvest a few dollars of edge, and the 85% win rate is most of what makes the trade feel like more than that. Question 3 — Is this even a good version of this trade? This is the one that got me. I ran a few neighbouring strikes on the same underlying, same expiration. Some of them carried a similar 85%-plus win rate with two to three times the expected value. Same probability of profit on the surface. A completely different edge underneath. If you sort your ideas by win rate, these trades look interchangeable. They aren't. The number that ranks them — expected value relative to capital — is the one that never makes it onto the headline. The point To be clear: this isn't a blow-up trade. It's defined risk — the loss is capped at the debit, and the tool says so. The danger here isn't ruin. It's quieter than that: a high win rate, a tiny payoff, and a thin edge you can't see if "85%" is the only number you look at. Win rate is the most seductive statistic in options and the least informative on its own. It tells you how often you'll be right. It says nothing about how much you make when you are, how much you lose when you're not, or whether the trade two strikes over is quietly three times better. How many "high-probability" trades have you taken that looked exactly like this one? To help you, the Trade Doctor shows up a validation checklist and some advice: Where this comes from This is Trade Doctor, one of the tools at OptionBench. You build a position leg by leg and it runs a statistical health check before you trade — probability of profit, yes, but also the expected P&L relative to the capital you're risking, the loss profile, liquidity, implied-vol context and event risk. Probability is one line on the checklist. This shows you the rest of it. OptionBench is entering beta. Beta testers get free access to every tool — Trade Doctor, the BOSS strategy scanner, and the rest — for June and July. If you've already signed up to test, you'll receive an email shortly inviting you to log in. We've had a great response and the beta list is well filled, but if a few more of you would like to put the tools through their paces, send me a DM and I'll get you in. — Romuald Figures are from a live TLT options chain (TLT @ $85.00) and are for research and educational purposes only. OptionBench is not a financial advisor and does not recommend any strategy. Options trading involves substantial risk and may result in significant losses.
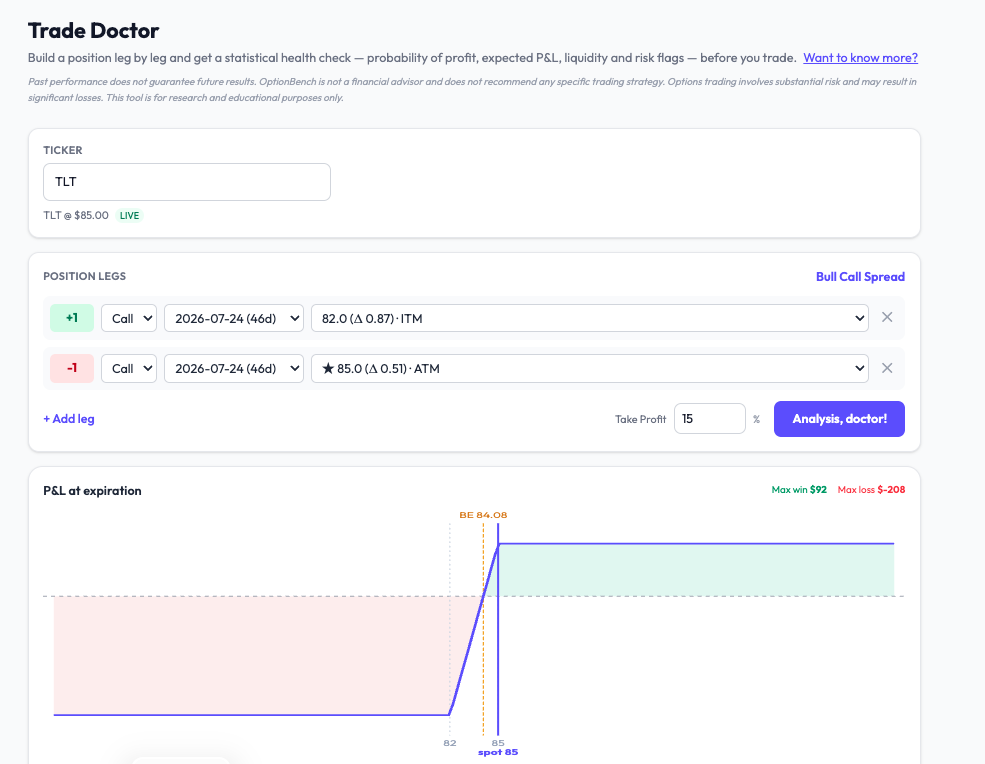
-
 Jgodni joined the community
 - Yesterday
-

Could This Strategy Be The Holy Grail Of Investing?
DataDan commented on Kim's article in SteadyOptions Trading Blog
I see it has to do with Anchor Trading. I looked at this and remember you need a pretty good size portfolio. I would never criticize what the team is doing here and that's what I think happened. They are pretty experienced. Here's one Anchor statement about portfolio size to keep in mind. What is the minimum account size for this strategy? Our model portfolio is $100,000. The trade alerts will be posted with regular SPY options. To implement the strategy, exactly as presented in the weekly trades, the minimum size account recommended is $50,000 (this is a total account size including all components). -
Could This Strategy Be The Holy Grail Of Investing?
DataDan commented on Kim's article in SteadyOptions Trading Blog
Not much talk today but I got to tell you this Holy Grail conversation completely confused me. I only skimmed it but didn't who was saying what. I have enough trouble keeping up with just with the normal SO Trades. -
@Hany Curious to know if you have noticed any degradation in your fills?
- Last week
-
 Sujatha joined the community
 -

Could This Strategy Be The Holy Grail Of Investing?
Kim commented on Kim's article in SteadyOptions Trading Blog
No idea. And I'm not sure how VIX buying method is related to Anchor lol.. but some people just like to troll. -

Could This Strategy Be The Holy Grail Of Investing?
TrustyJules commented on Kim's article in SteadyOptions Trading Blog
So where is that VIX Call buying method? /s -
Could This Strategy Be The Holy Grail Of Investing?
Kim commented on Kim's article in SteadyOptions Trading Blog
And here is a comment from someone I highly respect, a long time SA contributor who actually knows what he is talking about. -
Could This Strategy Be The Holy Grail Of Investing?
Kim commented on Kim's article in SteadyOptions Trading Blog
I went back and read some of the comments. All skeptics and naysayers were proven wrong, once again. Anchor strategy keeps crashing the S&P year after year. -
Could This Strategy Be The Holy Grail Of Investing?
Kim posted a article in SteadyOptions Trading Blog
 Does the Holy Grail even exist? Internet is full of hype from people who claim that they found the Holy Grail of Investing. "Make 10% per month in just 10 minutes per week". Do you really believe that? Some people do. I can tell you with full responsibility that whoever claims to have the Holy Grail is either lying or has not been in this business for long enough. This is why when my good friend and hedge fund manager Chris Welsh told me about his Anchor Strategy that aims "to prevent loss of capital in market downturns while still generating a positive net return in all market conditions", I was a bit skeptical. Isn't that the Holy Grail, which we know does not exist? However, when he described it, I became a believer. Not a believer that this is the Holy Grail, but a believer that this could be something that many long term investors could find very useful and help them sleep better at night as it reduces market risk without sacrificing all upside potential. Let's proceed to the 3 steps of this strategy. Step 1 - Stock selection When selecting stocks to invest in, consider the following factors: Highly correlated to the S&P 500; Expected to outperform the S&P 500 on an annual basis; Pays a dividend in excess of two percent; High liquidity; Trades on the option markets; Diverse across business segments (e.g. don't own all pharmaceuticals or consumer staples). The starting point can be a list of the Dividend Aristocrats, or any other stocks that are highly correlated to the S&P 500, particularly in down markets. Then we look at the following fundamentals, analyzing a company just as any value investor would. Selecting the right stocks would by itself significantly outperform the S&P 500. But in a down year like 2008 the portfolio would still lose money (although much less than the S&P 500). So now we are ready to go to the next step. P.S. Since the article was published, we have been using the Anchor strategy for indexes only, but it definitely be used for individual stocks. Step 2 - Fully hedge against market declines The full hedge is achieved by buying a number of SPDR S&P 500 (SPY) LEAPS put options that will fully protect the portfolio on an annual basis. By fully protect, I mean that if S&P falls by 10%, those puts will increase in value by 10% to fully cover the loss. This will not protect against a single equity losing value, such as if AT&T comes out with an unexpected adverse earnings report and drops in an uncorrelated manner to the S&P 500. The goal is to protect against market crashes. Since options are cheaper when volatility is lower, the ideal time to implement such a strategy is during a bull market. In fact, current market conditions make this strategy extremely viable and attractive. It can be implemented in any market, but the ideal time is near the peak of a bull market. However, hedging costs money. For example, the SPY June 2014 At The Money 161 puts catch a premium of $13. That means that if SPY is unchanged between now and June 2014, the hedge will cost us 8% of the total value of our portfolio. This of course is unacceptable. So now we are ready to go to the final step. Step 3 - Earn back the cost of the hedge To earn back the cost of the hedge, each week we will sell short weekly puts against our long puts. Over a full calendar year, the hedge should pay for itself. The devil as always is in the details. The following issues have to be resolved in order for the strategy to work successfully: How many long puts to buy, which strike and expiration? How many short puts to sell and which strike? What to do with the long puts when the market makes a strong move (up or down)? When to roll the short puts? Most of the time, the premium earned from selling the short puts should be enough to pay for the long puts on annual basis. The general idea is similar to what my fellow contributor Reel Ken described in his excellent article Hedging spy with options. The exact implementation is different and includes few twists that are beyond the scope of this article. How is the performance? The below table presents the results of backtesing, going back to 2007 (the returns include commissions, dividends and margin interest): Year Strategy return S&P 500 Return Difference 2012 13.527% 13.406% 0.121% 2011 18.368% -0.003% 18.371% 2010 20.574% 12.783% 7.791% 2009 23.717% 23.454% 0.263% 2008 27.908% -38.483% 66.391% 2007 5.221% 3.530% 1.691% Total 109.215% 14.687% 94.628% The most astonishing is the performance in 2008 - almost 28% gain compared to S&P 38% loss. The main reason for this outperformance is the fact that the long puts increased in value much more than "assumed" by the model due to spike in Implied Volatility. This is the reason why you buy protection when it's cheap, not when you need it. It should also be noted that much of the strategy's positive returns in years where the market was up (such as in 2010) was due to selecting stocks that outperformed the S&P 500, not due to the hedging technique which was used. Of course backtesting is not live trading and has its limitations. The strategy went "live" using real money on March 30, 2012 and continued to outperform, backing up the backtesting results. Selection of stocks played a big role in the outperformance. Those who do not wish to rely on their stock picking skills can buy one of the dividend ETFs like Vanguard Dividend Appreciation ETF (VIG) or SPDR S&P Dividend (SDY). You still get 2.5-3.0% dividend, and if you have portfolio margin, you can use leverage and buy those ETFs on margin. Since the long puts provide a full hedge, this technique should provide few extra percentage points while removing the stock selection risk. What are the risks? No strategy is without risks. Here are some of the risks associated with this strategy: Correlation risk, i.e. the long stocks or ETFs underperform the S&P 500. This happened in May 2013, with the stocks mentioned above significantly underperforming the S&P 500. In fact, while the market as a whole was up, the stocks owned were down - a situation the hedge does not cover at all. Like mentioned, one possible solution could be using SPY, VIG or SDY instead of stocks. Of course holding more stocks reduces the correlation risk. Single equity risk, i.e., the chance that one stock selected has an adverse event, or even files bankruptcy. This would not be covered by the hedge as the hedge is concerned with protecting against market downturns, not necessarily against the stocks you hold. The income from the short puts is not sufficient to pay back the long puts over the course of the year. This can happen when the market continues to whipsaw around your long put strike. However, such market behavior usually doesn't last for long. It could easily happen over a two month period, but is highly unlikely over the course of a full year. That said, in certain market conditions, it is completely possible to perhaps only pay for half of your hedge over the course of a year - not a likely risk, but it could happen. Assignment risk, i.e., the risk of having your short weekly puts assigned to you before you get the chance to roll them. This could lead to margin calls, forced liquidations of long positions, and the other issues which arise with unexpected assignment. Reduction in dividends. Since the dividends are relied on in up market years to help pay for the hedge, if a company reduces or eliminates its dividend, it may make paying for the hedge difficult. Conclusion In years where the market has positive net returns, the strategy targets lagging the S&P 500 by 2-3%. In neutral and negative market years the strategy targets a return of 5-7%. In extreme down years (defined as a return on the S&P 500 of under -10%), the strategy could lead to outsized gains, as occurred in 2008. Of course if the selected stocks outperform the S&P 500, even in bull markets the strategy could easily outperform its stated goals. The impact of not experiencing losses in down market years, while only slightly lagging (if lagging at all) in positive and neutral years, is astronomical over any extended period of time. Yes you may miss out on a few percentage points of gain in large bull markets. However, utilizing the Anchor strategy over a number of years, particularly if any of those years are bear markets, should lead to the strategy significantly outperforming the markets as a whole, as back-testing has demonstrated. Even in prolonged bull markets, the returns should still be positive. The peace of mind which comes with being fully hedged against a market downturn more than compensates for the potential of slightly underperforming the market as a whole in prolonged bull scenarios. Special thanks to Chris Welsh for contributing to this article. You can read more details about the strategy here. P.S. In January 2019 the implementation has been changed and Leveraged Anchor was born. Since inception, the leveraged Anchor is up 296.0%, compared to S&P 500 return of 173.1% (as of 12/31/2025). We also recommend reading How Anchor Survived the 2020 Crash. On March 19 2020, SPY at 234 (down 30%), Anchor UP $5k (~3%). Click here for a full analysis of 2022 performance.
 -

How To Start: Options Basics
Riles commented on Drew Hilleshiem's article in SteadyOptions Trading Blog
Thanks -
How To Start: Options Basics
Kim commented on Drew Hilleshiem's article in SteadyOptions Trading Blog
Last trade was on May 28, closed on June 1. -
How To Start: Options Basics
Riles commented on Drew Hilleshiem's article in SteadyOptions Trading Blog
I haven't received any trade emails recently. Just want to make sure I'm still on the rolls. Thanks -
How To Start: Options Basics
Kim commented on Drew Hilleshiem's article in SteadyOptions Trading Blog
Good catch, thank you. -

How To Start: Options Basics
Martin Sikora commented on Drew Hilleshiem's article in SteadyOptions Trading Blog
Hey Folks! The Example 3 doesn't reference correct strike figure nor assignment price. Also break even point is calculated with wrong inputs and lands at incorrect result. Please fix as the example is totally confusing for new traders. Best, Martin - Earlier
-
 Skelton joined the community
 -
 racerz2009 joined the community
 -
 one.novice joined the community
 -
 Gerd joined the community
 -
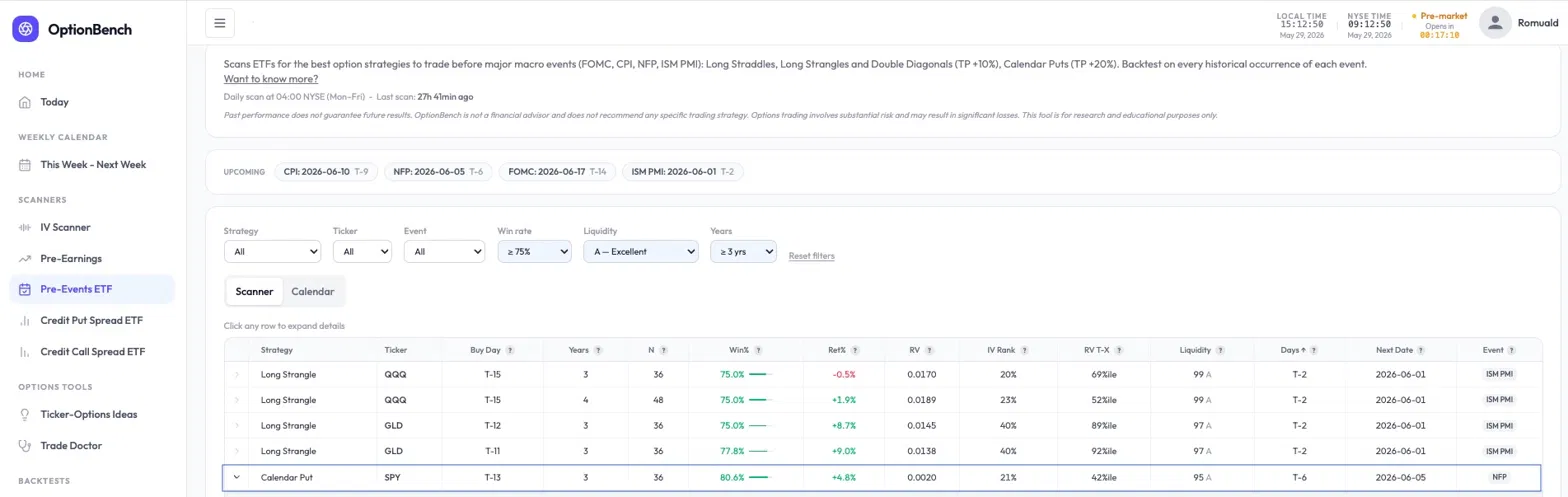
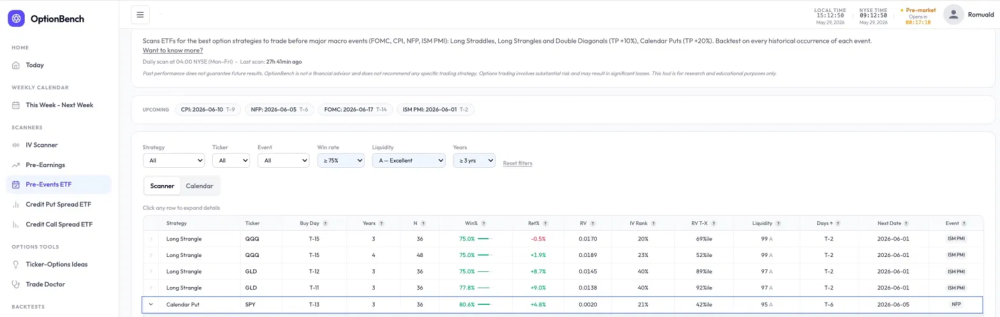
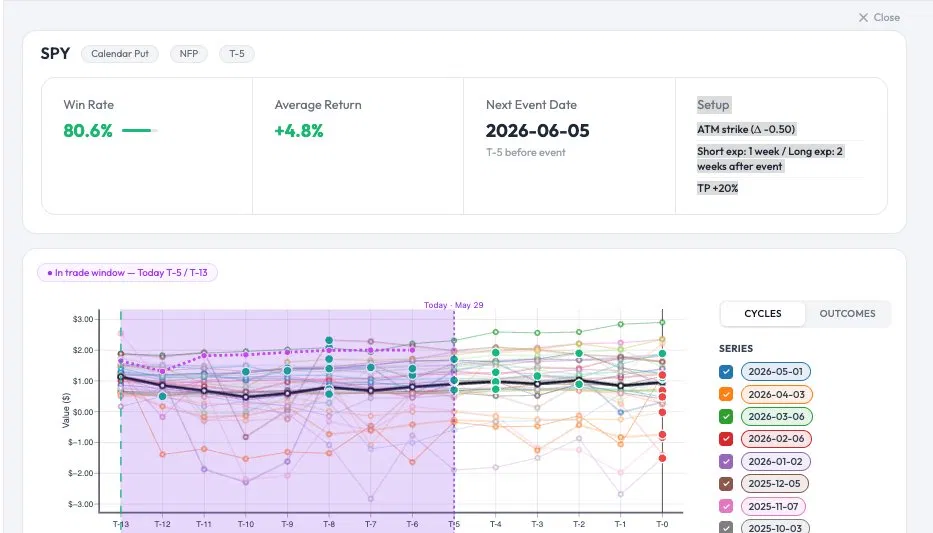
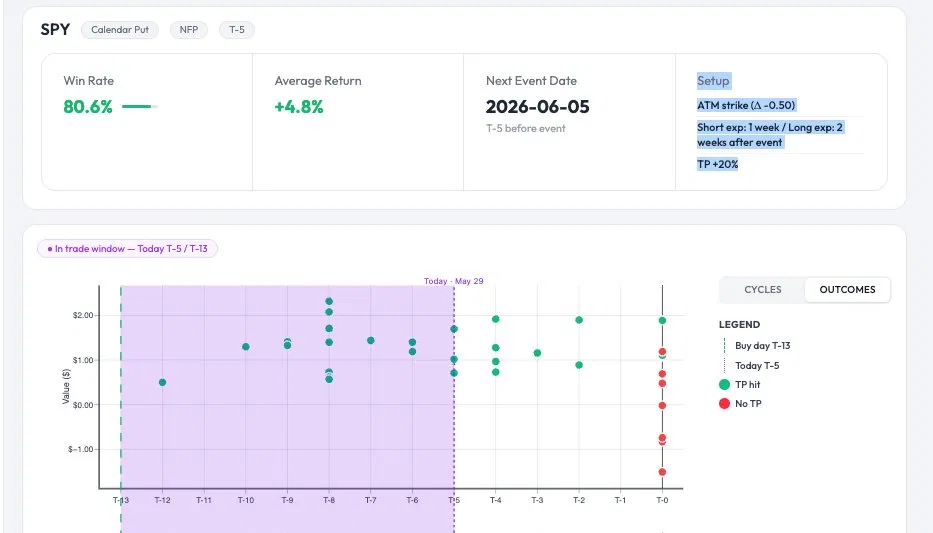
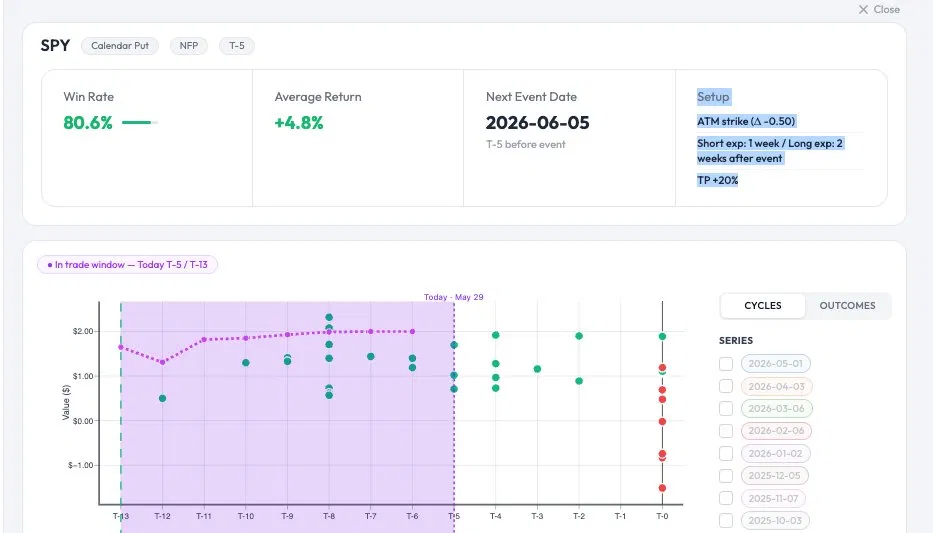
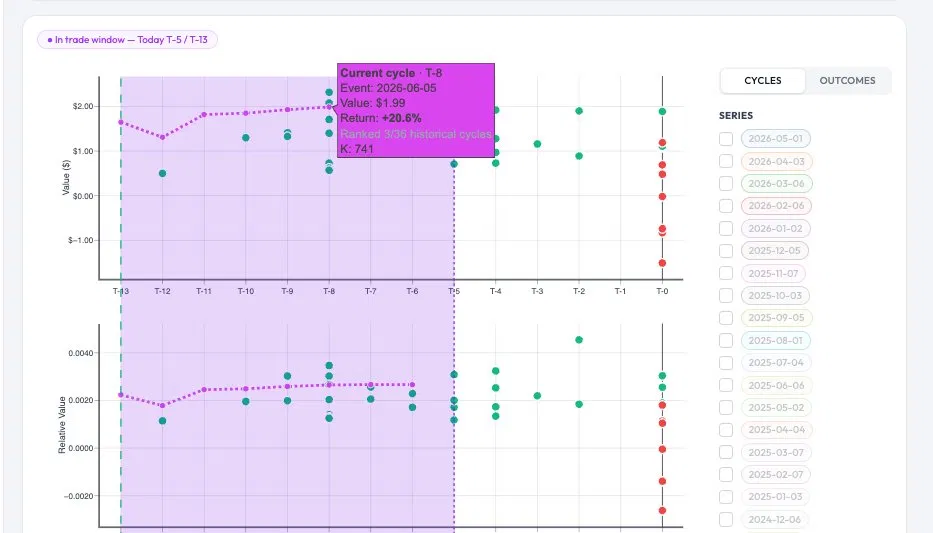
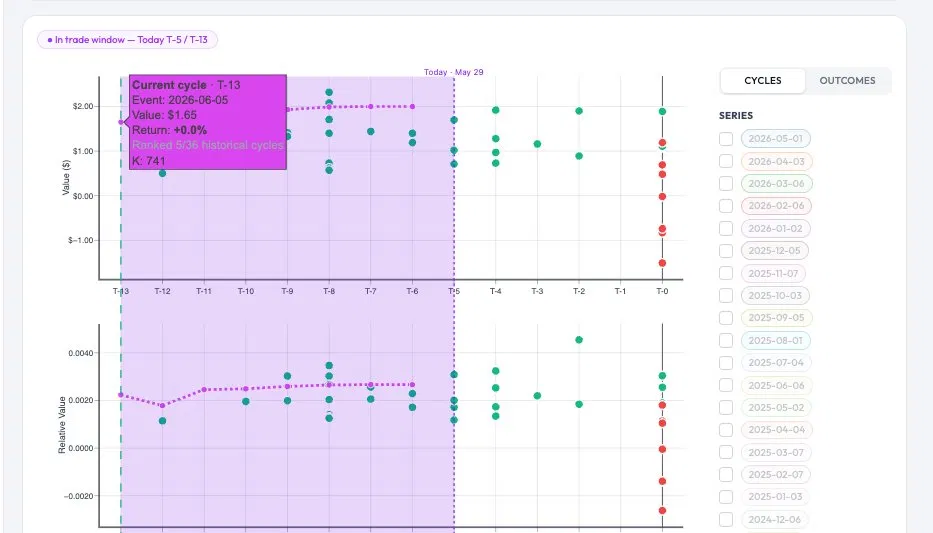
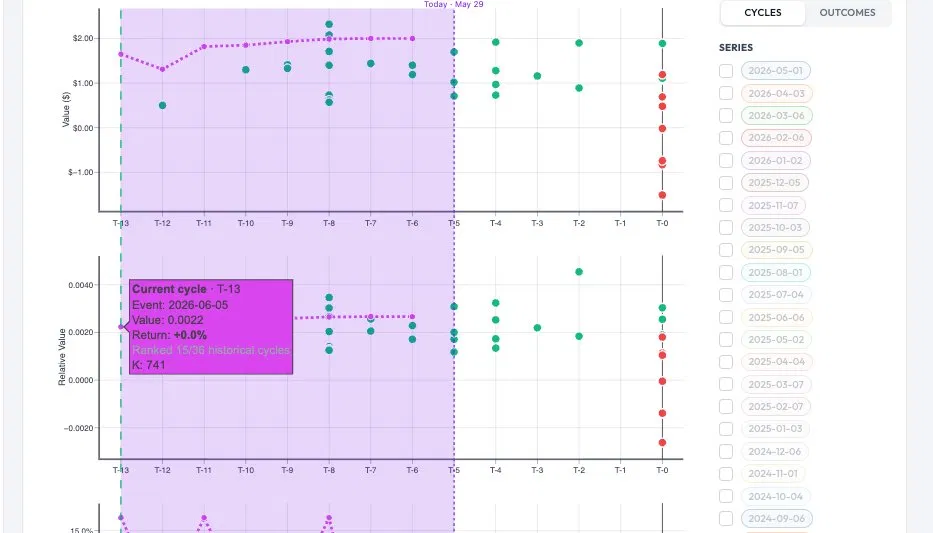
Beta testing OptionBench — a worked example on SPY Calendar Puts before NFP Hi all, I'm putting the finishing touches on https://www.optionbench.com , a research tool I've been building over the past months for options traders. It scans liquid US tickers across multiple strategy types (Credit Spreads, Long Strangles, Long Straddles, Calendar Puts, Double Diagonals, IV anomalies, pre-earnings and pre-event setups) and ranks historical performance per setup. The goal isn't to give signals — it's to surface candidates worth a closer look, with the math and the historical record laid out for you. I'm looking for a few more beta testers and early users before public launch. If you're interested, reply or DM me. To give you a concrete sense of what the tool does, here's a worked example from this morning's scan. Scanner: Pre-Events ETF This scanner looks at four recurring US macro events (FOMC rate decisions, CPI, NFP, ISM Manufacturing PMI) and backtests four option strategies around each event window: Long Straddle, Long Strangle, Calendar Put, and Double Diagonal. For each combination of (ticker × event × strategy × buy day from T-15 to T-9), it computes a win rate, average return, and various risk/structure metrics across all historical occurrences (up to 5 years). Take-profit thresholds are fixed per strategy (TP +10% for straddles/strangles/double diagonals, TP +20% for Calendar Puts). The setup The scanner flagged this row: Ticker: SPY Strategy: Calendar Put Setup: ATM strike (Δ ≈ -0.50), short exp 1 week after event, long exp 2 weeks after event, TP +20% Buy day: T-13 (13 business days before the event) Next event: NFP on June 5, 2026 (currently T-6, so the trade window has been open for 7 trading days) Backtest: 80.6% win rate over the last 3 years (36 cycles), average return +4.8% (losses included) In other words: buying an ATM Calendar Put on SPY 13 business days before each NFP release, holding until either TP +20% is hit or the short leg expires, would have been profitable in 29 of the last 36 NFP cycles, with an average return of +4.8% across all cycles. The detail view Clicking the row opens a per-cycle chart. Each colored line is one historical NFP cycle. The y-axis is the Calendar Put value in dollars over time, the x-axis is days before the event (T-13 to T+0 and beyond, since Calendar Puts can be held past the event due to the longer leg). The fuchsia dashed line is the current cycle — the trade that, per the rules, should already be open as of today (we're at T-6). The purple-tinted zone marks the active trade window (T-13 to T-5, since after T-5 you're carrying single-leg risk only). Filtering noise 36 cycles is a lot of lines. The OUTCOMES toggle hides the in-trade trajectories and shows only the exit points: green for "TP hit before the short expires", red for "no TP, exited at short expiry". You can see the distribution clearly — most exits are green, and many happen well before the event. Focusing on the live cycle Most useful for an actual trader: unselect all historical series and keep only the current cycle. You get a clean view of how today's trade is tracking. Hovering T-8 shows that the TP of +20% was actually hit 5 trading days ago: entry was $1.65 at T-13, value reached $1.99 at T-8 → +20.6% return. So in real terms, this trade would already be closed in profit. The tooltip also shows "Ranked 5/36 historical cycles" — meaning today's entry price was the 5th highest of the 36 historical cycles. We paid up. But the trade still worked, which is the interesting part of this example. The lower subplot tracks relative value (Calendar Put cost divided by spot), where today's entry ranked 15/36 — squarely in the middle of the historical distribution. So while the absolute dollar cost was high (SPY is at all-time highs), the cost relative to spot was unremarkable. What I'd like from beta testers Use the tool over a few sessions Tell me what's confusing, what's missing, what's wrong Suggest scanner ideas or metrics that would help your actual workflow The tool isn't a black box: every number on the dashboard maps back to an explicit, documented calculation, and I'm happy to walk through the methodology with anyone interested. Reply here or DM to sign up. — Romuald https://www.optionbench.com
-

Spreadable Mobile Trading App created for Steady Options
Bull3t007 replied to Bull3t007's topic in Promotions and Tools
Potentially Android in the future:) -

Spreadable Mobile Trading App created for Steady Options
DEAN replied to Bull3t007's topic in Promotions and Tools
Will this app be available for Android or browsers? -
 11october11 joined the community
 -
 Reingirl joined the community
 -
 Trader321 joined the community
 -
 Brokers provide expert knowledge, tools, and support that enable traders to maximize their potential. So, understanding why brokers are a must-have ally is important for reaching trading success. The Role of Brokers in Trading Brokers have always been a highly important element of financial markets, initially serving as intermediaries between buyers and sellers. Although their role remains unchanged today, brokers provide much broader services tailored to the current trading needs, including access to trading platforms, market analysis resources, educational materials, and even financial advice. Brokers serve as gateways to global financial markets. Most people and institutions do not have direct access to exchanges or over-the-counter markets themselves. Therefore, brokers provide access to trading technology as well as the infrastructure required to facilitate successful trade placement. Gatekeepers to the Financial Markets One of the main reasons traders require brokers is access. Financial markets such as stocks, forex, commodities, and derivatives can be complex systems requiring expert knowledge and advice for trading success. Brokers provide easy access to these systems. Without brokers, individual traders would struggle to access exchanges directly in order to place trades. Brokers provide access to these markets via trading platforms designed for speed and efficiency. Brokers provide traders with a service of swift execution of stock purchases or forex trades within seconds or accessing leveraged trading facilities allowing larger positions without the need for significant capital, which is an important feature for retail traders. Expertise and Reliable Market Insight Markets are in constant flux, driven by economic news, geopolitical events, market sentiment, and more. Staying on top of market developments requires skill, knowledge, and real-time insights from brokers who act as guides for traders’ trading activities by providing research reports, analyst forecasts, and news updates tailored to traders’ portfolios. Providing them with expert guidance that could make the difference between successful trading and costly mistakes. Advanced Tools for Enhanced Trading Strategies Being successful as a trader depends on more than simply instinct. Effective decision-making requires powerful tools that support it. Brokers offer traders cutting-edge trading platforms, featuring charting software, technical indicators, and automated trading options that allow for accurate market analysis, identification of trends, and strategy execution. Also, brokers often provide proprietary applications with features like real-time price alerts, backtesting capabilities, and risk management tools. Some even provide Application Programming Interfaces (APIs), which enable advanced users to create custom trading algorithms. Providing traders with tools necessary for enhanced decision-making and better strategies. Security, Regulation and Reassurance Financial trading comes with inherent risks. Working with a regulated broker significantly mitigates those risks by operating under stringent regulations that protect traders’ funds from fraud or malpractice while adhering to financial laws. Many brokers are required to hold client funds in segregated accounts to prevent misuse or misallocation. To provide traders with reassurance, choose one with an effective regulatory framework. Brokers are regularly monitored by regulatory bodies, which ensure they adhere to standards of transparency and operational integrity. This level of security allows traders to focus on developing strategies without worrying about whether their investments are secure. The Human Touch While trading may increasingly depend on algorithms and technology, brokers still provide personalized support and customer service that cannot be replicated by technology alone. From helping resolve technical issues to offering tailored advice, brokers bring human interaction that builds deeper levels of trust between traders and brokers. Also, some brokers assign dedicated account managers for higher-value clients for even further personalized attention, creating an atmosphere in which traders feel supported as they pursue their financial goals. Cost-Effectiveness and Added Value Although brokers charge fees, such as commissions, spreads, or fees for their services, they often deliver a lot of value. Many brokers operate transparent pricing structures so traders know exactly what they’re paying for. Providing access to expensive trading platforms, tools, and research, the fees may far outweigh costs associated with using a broker. Conclusion Brokers aren’t simply intermediaries. They’re true partners in any trader’s financial journey. Providing access, expertise, tools, and support services that enable traders to realize their full potential in the financial markets. From novice traders exploring their first trades to experienced portfolio managers managing complex portfolios, brokers remain important at each stage. Ultimately, this relationship between traders and brokers is mutually beneficial. Brokers benefit by serving their clients efficiently while traders succeed with resources provided by brokers. This partnership illustrates why traders (no matter their experience level) truly need brokers in the trading sphere. This is a contributed post.