.thumb.jpg.ab4e561cf64facc1a9f2495da9a3757e.jpg)
Either puts or calls can be used, while puts are usually preferable to avoid dividend assignment risk.
These are notoriously 'boring' (read profitable) trades and work well in low volatility environments on stocks that are not demonstrating much trend or find themselves in a consolidation phase.
Since most traders use calendars as directionless trades, they are thought to lose value in trending markets. In this article, we'll challenge this view by expanding the use of calendars to directional, out-of-the-money (OTM) options trades and compare them against their more popular debit vertical spread cousin.
An OTM Calendar has the same mechanics of the long calendar that we're used to except now we look to strike prices away from the current underlying price in order to express our directional assumption. We look to higher strikes with calls when we have a bullish assumption and we look to lower strikes with puts if we have a bearish bias.
The price (and therefore maximum loss) of the calendar will decrease the further out of the money we go as well will the probability of touch (or profit). If we go out far enough we will see theta go from positive (typical in an at-the-money or ATM calendar) to negative (more typical of a long options position).
The goal of the OTM Calendar trade remains the same as traditional ATM calendars - we're looking for the price of the underlying to be as close as possible to short and long strike shared in the calendar at the front-month's expiration. What's different is that we need price movement to get there versus prices standing still.
What is most interesting, and the focus for the remaining of this article, is to compare the OTM Calendar spread against other directional options trading types.When looking for a directional options trade, most traders gravitate toward vertical debit spreads and therefore will be our basis of comparison.
So, let’s look at 3 strikes (275, 280, 285) with an equivalent vertical and OTM call calendar spread on the SPY with a current price near $271/share at the time of writing:
|
Strike Target |
Full Trade |
Short Name |
|
275 |
VERTICAL SPY 10029 MAR 18 270/275 CALL @2.90 |
270/275 Vertical |
|
280 |
VERTICAL SPY 100 29 MAR 18 275/280 CALL @1.60 |
275/280 Vertical |
|
285 |
VERTICAL SPY 100 29 MAR 18 280/285 CALL @.65 |
280/285 Vertical |
The Risk/Reward Profile: Debit Vertical Spreads vs. OTM Calendars
Let’s first take a simple look at the risk/reward of these various positions and how they compare.
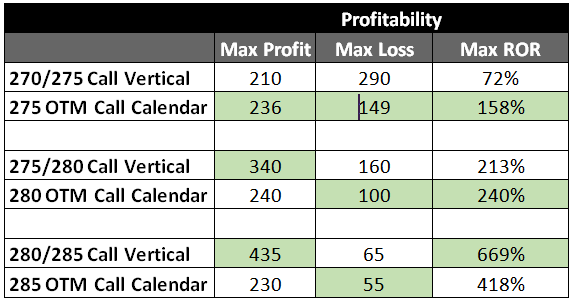
Profitability Comparison – Verticals vs. OTM Calendars
From the table above, we can make the conclusion that the OTM call calendars have a higher return on risk (ROR) vs. the call verticals with exception of the 285 OTM call calendar. This generally holds true in most market environments. We’ll come back to the behavior of the 285 OTM calendar shortly in a later discussion. Next we’ll compare the greeks across the various positions.
Comparing the Greeks Between Call Debit Spreads and OTM Calendar Spreads
Before we take a look at the greeksof our comparison positions, let’s review what we generally looking for in a bullish-directional options trade:
- Delta – We are looking for a high positive delta to match our bullish assumption. This allows us to maximize our profit with each $1 appreciation in the underlying stock.
- Gamma – We are looking for positive gamma to ensure our delta is becoming more positive as the trade moves in the correct direction.
- Theta – We are used to paying premium for the right to have a directional assumption, however, we always want as positive theta as possible (or less negative in long positions) so we pay less to hold the trade.
- Vega – We want a positive vega to ensure that if we have expanding volatility in the stock from drastic price movements that we capture some downside protection.
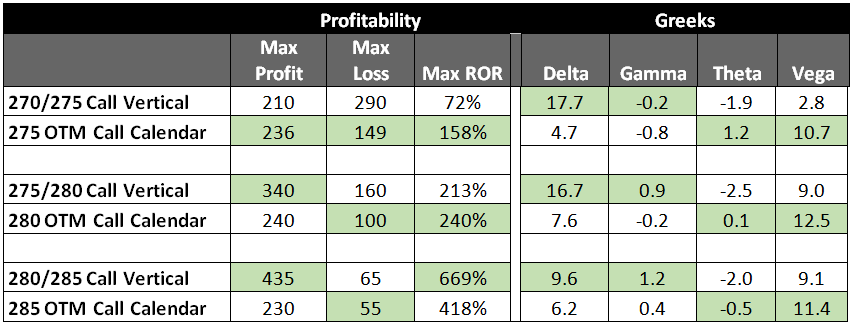
Profitability & Greeks Comparison – Verticals vs. OTM Calendars
Let’s look at the comparison between call verticals and OTM call calendars for each of the greeks.
Delta
The vertical spreads consistently created higher delta, which is great for our directional assumption. Vertical spreads will profit faster from price movements than the OTM calendars. There is a trade-off here in terms of the cost to hold the trade. We’ll discuss this in greater detail when we look at theta.
+1 for Vertical Spreads.
Gamma
The vertical spreads also have a higher gamma. We can expect delta to become higher as the stock appreciates with the exception of the 270/275 Vertical which is already in the money.
It’s very clear from looking at Delta and Gamma that, when compared to the OTM Calendar spreads, the verticals are much faster moving setups which allows us to profit more rapidly from sudden price moves in our favor. However, the opposite is also true where we lose money faster if the stock moves against our position.
+1 for Vertical Spreads.
Theta
So far the vertical spreads are beating out the OTM Calendars, but this is where things finally get interesting. All of the vertical spreads have negative theta. I.e., we pay to hold the position each day, whether the underlying moves or not.
The 275 Calendar and the 280 Calendar both have positive theta, which means we can expect to profit even if the stock stays stagnant and doesn’t move in our favor. This is impressive considering we maintain positive delta and a bullish assumption.
The 285 Calendar is sufficiently out of the money that its theta has turned negative, but we still save 1.5 theta against the equivalent vertical position. We do pay for this luxury and this is where we finally circle back to the profitability evaluation. The 285 Calendar above has less ROR than the equivalent vertical position because we’re taking a tradeoff between less profitability and paying less per day as we wait for our price movements.
+1 for Calendars Spreads.
Vega
This is where the calendar spread really shines. We see consistently higher vega in the Calendar Spreads vs. the Vertical Spreads. Any increase in implied volatility from actual price movement or from market news/speculation will benefit the calendar. In fact, if the underlying’s price moves away from our desired strike we’ll see downside protection so long as volatility expands with the price movement.
It’s helpful to show a visual comparison here. The various colored lines in the charts below show 1% volatility steps in the SPY (4% total range). You can see how dramatically volatility affects the calendar vs. the vertical. In the charts below you’ll see that the calendars downside protection moves to $264.30 vs. $270.30 in the vertical spread.
+1 for Calendar Spreads.
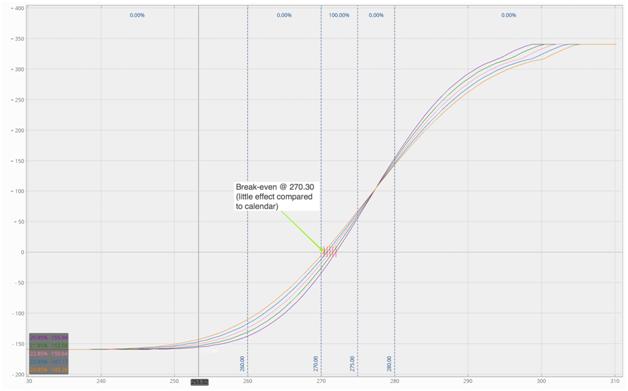
Volatility Expansion Effect on Break-Even of Vertical Call Spreads
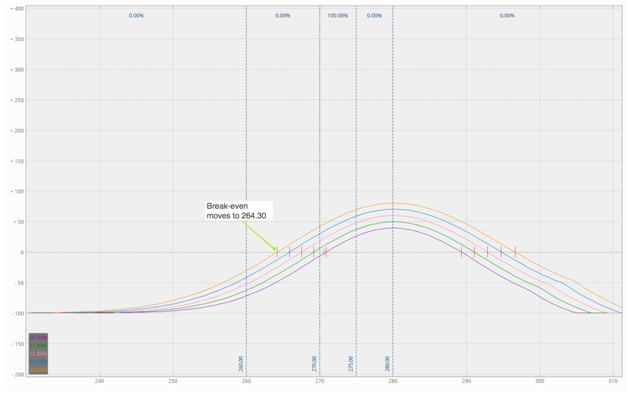
Volatility Expansion Effect on Break-Even of OTM Calendar Spreads.
The last thing that needs to be said about vega is its effect on profitability. Let’s look at the previous table but this time consider that volatility has expanded by 4% in the SPY. All OTM Call Calendars max profit increase with expanding volatility while the vertical spreads do not change.
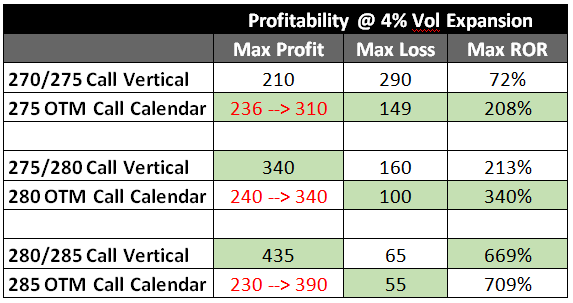
Volatility Expansion Effect on Profitability Comparison Between Verticals and OTM Calendards
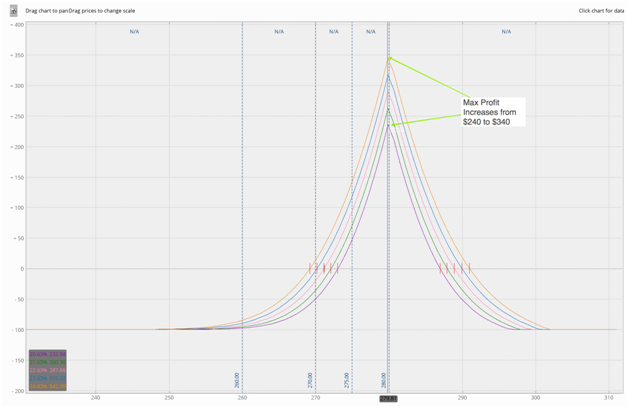
The chart below shows expanding volatility’s effect on the 280 OTM Call Calendar:
Do OTM Calendar Spreads Beat Vertical Spreads?
So we end up with 2 points for the vertical spreads and 2 points for the calendar spreads. This isn’t surprising – all trading consists of various trade-offs. We can trade delta for theta, gamma for vega, risk for reward.
What we can conclude is that OTM Calendar Spreads provide a very interesting risk/reward profile and have dramatic benefits in the right environment. It’s up to you to scan for these opportunities.
OTM Calendar Spread Management
Assuming you see the merit in diversifying your directional options trading strategies with OTM Calendar Spreads, then let’s take a quick look a trade management rules-of-thumb.
Here are five specific potential outcomes to think about for closing out and banking a profit (or learning from a loss):
1. Stock Moves in Your Desired Direction but Doesn't Hit the Target Strike
An OTM put calendar is one with a strike price below the market price of the underlying asset while an OTM call is the opposite. If the stock moves slowly in your direction and the position has a positive theta, then you can afford to wait out the trade. This is the ideal behavior for these setups.
When to get out?
If you've made 25% of the max profit; once you achieve this rule-of-thumb checkpoint, exit the trade.
2. Stock Moves in Your Direction and Hits the Target Strike
Be mindful of a situation where the price of the underlying approaches and reaches the position’s strike price. You want to be ready with a conditional closing order to get out of the position(s) if this becomes a reality, something most brokerage trading platforms permit.
Set alerts as well as a reminder that this action should be taken immediately to avoid potential loss. Remember that calendars unlike vertical spreads will start to show negative delta as soon as the underlying passes the chosen strike.
3. When/If Volatility Expands
Calendars benefit tremendously when volatility expands.
If you are using OTM put calendars you will likely see double the benefit as falling prices are almost always coupled with expanding volatility. In this case, wait for your target strike to take off the trade.
If you are using OTM call calendars then you need to be very mindful of expanding volatility. If volatility expands but you are seeing favorable price movement then you can consider taking off the trade. If volatility expands because the underlying’s price is falling, then you will see some cushion in your loss but you should consider taking off the trade.
4. When/If Volatility Contracts
Contracting volatility is not a good environment for calendar spreads. This is why we almost always put on calendars (both ATM and OTM) when volatility is at the low end of the range. We look to measure such as IV Percentile and IV Rank to determine if the current volatility is relatively low or high.
Despite best efforts to avoid contracting volatility with thorough evaluation of relative volatility at trade entry, it does happen time to time. When this happens it’s best to close the position.
5. If the Stock Moves in the Opposite Direction of OTM Calendar’s Strike.
Continue to monitor and manage as you would a stock position. If you are using call OTM calendars, you will likely get a bit of a cushion with moves in the opposite direction because volatility usually expands with falling prices. Put OTM Calendars, however, often get hit twice as hard as the stock drifts away from the chosen strike price.
Final Note: Consider Your Position Size at Entry.
OTM Calendars allow you to spend a little to make a lot. Calendars are also debit spreads and you can never lose more than spent at trade entry. For this reason, keep your position size small enough (and manageable) so that it would have resembled the potential loss from where you would set your stop-loss on a stock-only position.
Doing this allows you to sit back and just ride out the entire trade. The dynamics above can often reverse as well and turn a losing trade into a profitable one. In my own trading, I only use the 25% rule and just keep the positions very small.
Conclusion – Should You Consider an OTM Calendar and When to Use them?
All of this wonderful information begs a very fundamental question: should you consider an OTM Calendar and, more importantly (if yes), when do you use this setup? Here are four considerations to ponder that may make clear how useful an OTM Calendar is for you, taking into account the above points.
- When volatility is relatively low. This is particularly true compared to vertical contracts.
- When you're looking for time to work in your favor.
- When you have either a slight or major directional bias.
- In a voracious bull market, where premium selling opportunities are minimal.
I hope you found this article interesting and valuable. Of course, I’m only scratching the surface of the subject so look forward to your questions and comments below.
Drew Hilleshiem is the Co-Founder and CEO of OptionAutomator, an options trading technology startup offering a free options screener that leverages Multi-Criteria Decision Making (MCDM) algorithms to force-rank relevancy of daily options opportunities against user’s individual trading criteria. He is passionate to help close the gap between Wall Street and Main Street with both technology and blogging. You can follow Drew via @OptionAutomator on Twitter.


Create an account or sign in to comment
You need to be a member in order to leave a comment
Create an account
Sign up for a new account. It's easy and free!
Register a new account
Sign in
Already have an account? Sign in here.
Sign In Now