SteadyOptions is an options trading forum where you can find solutions from top options traders. Join Us!

We’ve all been there… researching options strategies and unable to find the answers we’re looking for. SteadyOptions has your solution.

Trend Following: An 88 Year look at S&P 500


Many investors have become interested in trend following strategies in recent years due to the scars of living through two major bear markets since 2000. In my firm, we also believe in trend following as a sustainable method for managing the downside risk of investing in risky assets like equity index funds and ETF's. 

A principle of quantitative investing is that the more data you have, the better. Below is an example of trend following the S&P 500 with a combination of 6 to 12 month absolute momentum since 1930. Individuals interested in recreating this simulation on their own can contact me directly at jblom@lorintine.com.  A hypothetical rules-based backtest this long includes the greatest crash we’ve ever seen in US stocks where the S&P declined 80% during the great depression. Some may get distracted by the discussion on how the markets were “different” then vs. now. The objective here is only to see how well a simple model holds up on as much historical data as possible. We’re looking for robustness.


Portfolio 1: Momentum (Either in the S&P 500, bonds, or a combination of both based on absolute or "time series" momentum)


IVV1930: This is a custom built dataset of S&P 500 total returns where index data is used prior to modern day investable products like the iShares ETF, IVV, which are used when they became available.  


Click on all images for greater clarity.

1.png


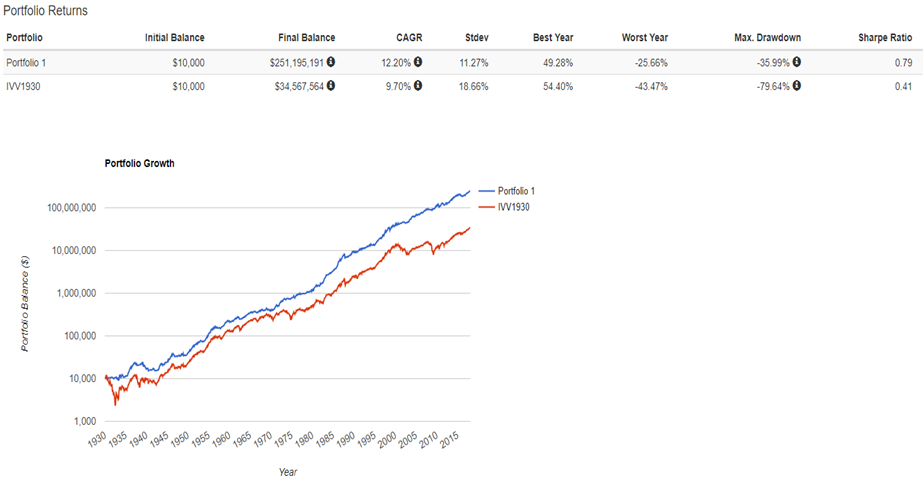
Every statistic is improved, except best year, which is expected, because during positive outlier years the best a single asset trend system can really be expected to do is match the buy and hold return. The most notable improvement is the reduction in volatility and drawdown, which is a common trait of simple trend following systems like this. 35% is still a large and very uncomfortable maximum drawdown, which is why diversification is always recommended and how we actually implement these concepts in our firm for our clients. 


I find it interesting to actually zoom in on the great depression period because backtesting does a great job of simulating everything about past performance EXCEPT how it would have actually felt to live through it. Cliff Asness says it well in his description of what he calls time dilation:


"Well the single biggest difference between the real world and academia is - this sounds overly scientific - time dilation. I’ll explain what I mean. This is not relativistic time dilation as the only time I move at speeds near light is when there is pizza involved. But to borrow the term, your sense of time does change when you are running real money. Suppose you look at a cumulative return of a strategy with a Sharpe ratio of 0.7 and see a three year period with poor performance. It does not phase you one drop. You go: “Oh, look, that happened in 1973, but it came back by 1976, and that’s what a 0.7 Sharpe ratio does.” But living through those periods takes — subjectively, and in wear and tear on your internal organs — many times the actual time it really lasts. If you have a three year period where something doesn’t work, it ages you a decade.  You face an immense pressure to change your models, you have bosses and clients who lose faith, and I cannot explain the amount of discipline you need."


2.png


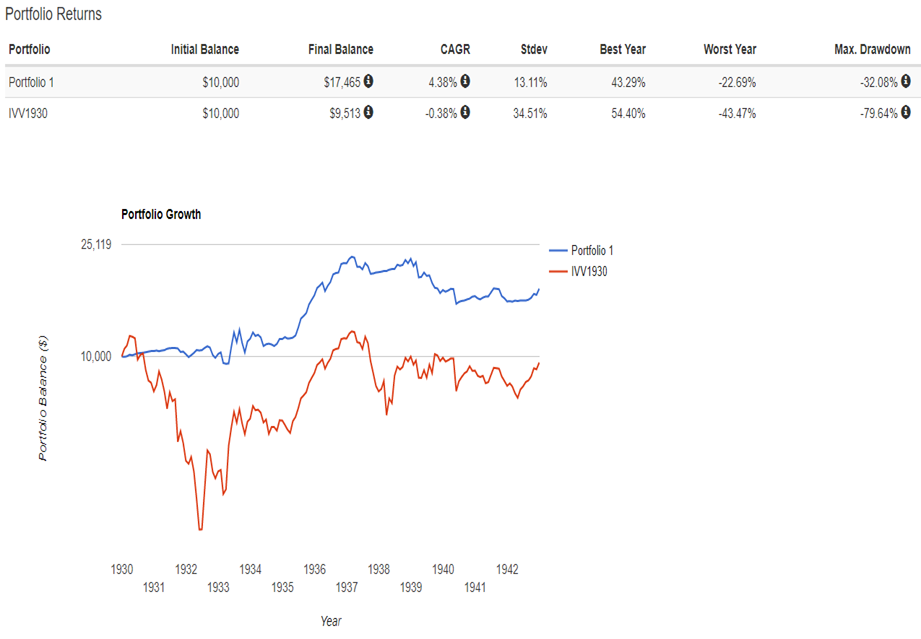
Based on my decade of experience in working with investors, I can imagine the fear being so strong during this kind of period that investors would have bailed on the trend system even when it was doing its job of preserving capital. Certainly there was something else in the world that was making money during this period for investors to compare performance to and chase after the fact returns. When it comes to stocks, as prices go lower and therefore future expected returns increase…for some reason investors become less interested.  Perhaps this would be different if stock prices were quoted in yields instead? I don't know, but behavioral biases are actually part of the academic explanation of why trend following has held up for so long, including well after its discovery.


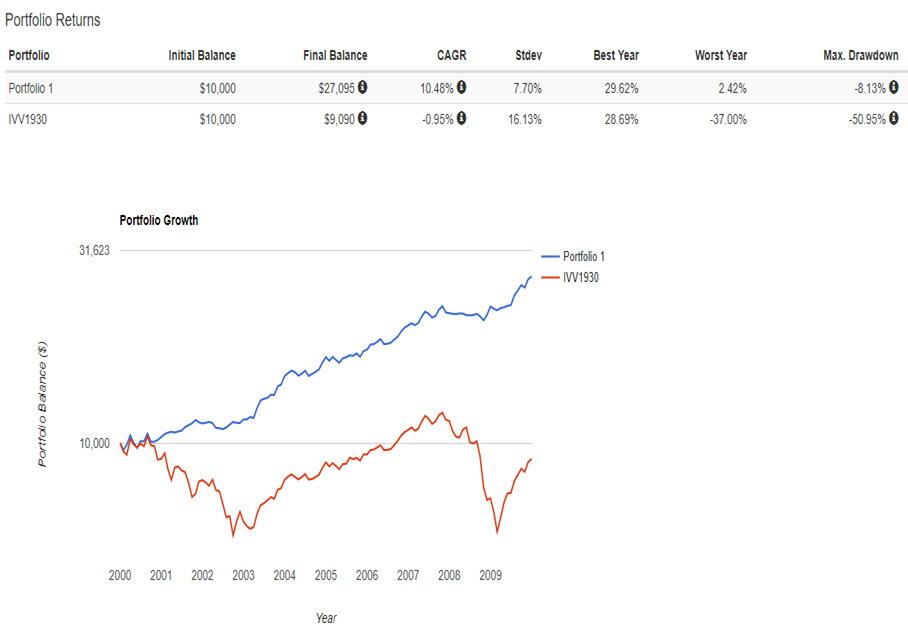
In more recent history, we saw a similar stretch in markets from 2000-2009, now referred to as “the lost decade” for the S&P 500. Trend following performed extremely well during this period, probably even better than should be expected during the next bear market due to how relatively stable both the up and down trends were during this period and also how strong the performance of US aggregate bonds was as a risk-off asset. 


3.png


Trend following does tend to under perform during strong bull markets like we've seen since 2010, so investors must manage expectations accordingly. The only way to get 100% of the upside is to accept 100% of the downside. Also, trend following is going to generate turnover that will make it less tax efficient than buy and hold and should therefore be favored in tax advantaged accounts for high income earners. All of these things are what we can assist clients with in designing a comprehensive asset allocation plan that suits your personalized situation and needs. 


Jesse Blom is a licensed investment advisor and Vice President of Lorintine Capital, LP. He provides investment advice to clients all over the United States and around the world. Jesse has been in financial services since 2008 and is a CERTIFIED FINANCIAL PLANNER™. Working with a CFP® professional represents the highest standard of financial planning advice. Jesse has a Bachelor of Science in Finance from Oral Roberts University. Jesse oversees the LC Diversified forum and contributes to the Steady Condors newsletter. 

What Is SteadyOptions?

12 Years CAGR of 122.7%

Full Trading Plan

Complete Portfolio Approach

Real-time trade sharing: entry, exit, and adjustments

Diversified Options Strategies

Exclusive Community Forum

Steady And Consistent Gains

High Quality Education

Risk Management, Portfolio Size

Performance based on real fills

Subscribe to SteadyOptions now and experience the full power of options trading!
Subscribe

Non-directional Options Strategies

10-15 trade Ideas Per Month

Targets 5-7% Monthly Net Return

Visit our Education Center

Recent Articles

Articles

  • SPX Options vs. SPY Options: Which Should I Trade?

    Trading options on the S&P 500 is a popular way to make money on the index. There are several ways traders use this index, but two of the most popular are to trade options on SPX or SPY. One key difference between the two is that SPX options are based on the index, while SPY options are based on an exchange-traded fund (ETF) that tracks the index.

    By Mark Wolfinger,

    • 0 comments
    • 871 views
  • Yes, We Are Playing Not to Lose!

    There are many trading quotes from different traders/investors, but this one is one of my favorites: “In trading/investing it's not about how much you make, but how much you don't lose" - Bernard Baruch. At SteadyOptions, this has been one of our major goals in the last 12 years.

    By Kim,

    • 0 comments
    • 1,281 views
  • The Impact of Implied Volatility (IV) on Popular Options Trades

    You’ll often read that a given option trade is either vega positive (meaning that IV rising will help it and IV falling will hurt it) or vega negative (meaning IV falling will help and IV rising will hurt).   However, in fact many popular options spreads can be either vega positive or vega negative depending where where the stock price is relative to the spread strikes.  

    By Yowster,

    • 0 comments
    • 1,386 views
  • Please Follow Me Inside The Insiders

    The greatest joy in investing in options is when you are right on direction. It’s really hard to beat any return that is based on a correct options bet on the direction of a stock, which is why we spend much of our time poring over charts, historical analysis, Elliot waves, RSI and what not.

    By TrustyJules,

    • 0 comments
    • 791 views
  • Trading Earnings With Ratio Spread

    A 1x2 ratio spread with call options is created by selling one lower-strike call and buying two higher-strike calls. This strategy can be established for either a net credit or for a net debit, depending on the time to expiration, the percentage distance between the strike prices and the level of volatility.

    By TrustyJules,

    • 0 comments
    • 1,797 views
  • SteadyOptions 2023 - Year In Review

    2023 marks our 12th year as a public trading service. We closed 192 winners out of 282 trades (68.1% winning ratio). Our model portfolio produced 112.2% compounded gain on the whole account based on 10% allocation per trade. We had only one losing month and one essentially breakeven in 2023. 

    By Kim,

    • 0 comments
    • 6,301 views
  • Call And Put Backspreads Options Strategies

    A backspread is very bullish or very bearish strategy used to trade direction; ie a trader is betting that a stock will move quickly in one direction. Call Backspreads are used for trading up moves; put backspreads for down moves.

    By Chris Young,

    • 0 comments
    • 9,851 views
  • Long Put Option Strategy

    A long put option strategy is the purchase of a put option in the expectation of the underlying stock falling. It is Delta negative, Vega positive and Theta negative strategy. A long put is a single-leg, risk-defined, bearish options strategy. Buying a put option is a levered alternative to selling shares of stock short.

    By Chris Young,

    • 0 comments
    • 11,493 views
  • Long Call Option Strategy

    A long call option strategy is the purchase of a call option in the expectation of the underlying stock rising. It is Delta positive, Vega positive and Theta negative strategy. A long call is a single-leg, risk-defined, bullish options strategy. Buying a call option is a levered alternative to buying shares of stock.

    By Chris Young,

    • 0 comments
    • 11,914 views
  • What Is Delta Hedging?

    Delta hedging is an investing strategy that combines the purchase or sale of an option as well as an offsetting transaction in the underlying asset to reduce the risk of a directional move in the price of the option. When a position is delta-neutral, it will not rise or fall in value when the value of the underlying asset stays within certain bounds. 

    By Kim,

    • 0 comments
    • 9,967 views

  Report Article

We want to hear from you!


How donyou backtest your strategy?İt is like portfolio visualizer but more long time period.

Share this comment


Link to comment
Share on other sites


Create an account or sign in to comment

You need to be a member in order to leave a comment

Create an account

Sign up for a new account. It's easy and free!


Register a new account

Sign in

Already have an account? Sign in here.


Sign In Now

Options Trading Blogs