- “The Fed’s Magic Money-Printing Machine”
- “Bernanke Admits to Congress: We are printing money, just not literally”
- “America’s reckless money-printing could put the world back into crisis”
- “Why Quantitative Easing isn’t printing money”
Some will say that the question is irrelevant, as QE ended a few years ago. We disagree, and it has nothing to do with proving our opinion on the matter right or wrong. It is extremely important to understand what QE is and is not as the reversal of QE, known as Quantitative Tightening (QT), has just begun.
By understanding the mechanics of QE, we can look forward to appreciate the effects that QT might have on the economy and the financial markets. Consider the words of Harley Bassman, a seasoned Wall Street veteran and derivatives expert: “However, I will fully support the notion that G-4 Quantitative Easing drove up asset prices; and that the removal of such money-printing will have a deleterious effect on financial assets.”
What is QE?
QE is being employed around the world by central banks to support and liquefy financial markets, lower interest rates, improve banks’ capital positions and promote stronger economic growth. Each central bank has nuanced differences in their provision of QE, primarily in the type of securities they purchase, but they are very similar in what they accomplish. In this article, we focus on the Federal Reserve’s (Fed) version of QE.
To help you better understand QE, we present the sequence in which the Fed executed this policy.
1) The process started when the Fed solicited offers for specific U.S. Treasury and Mortgage-Backed Securities (MBS) from investors including banks, brokers, individuals, mutual funds, pension funds, and foreign investors. While the trades were all executed through primary dealers, the ultimate seller in many cases was not the dealer. To ascertain whether QE is money printing, consider the following questions: Did investors accept something other than cold-hard cash for their bonds? What was the source of that cash?
2) As QE progressed, the Fed removed bonds from the market and investors in those bonds were left with cash. Cash-rich investors bought new bonds, stocks, and other assets. Further, some of the proceeds from sales of securities to the Fed were likely deployed outside of the financial markets. Whether it was the original seller or the recipient of the money five transactions down the line, a portion of the Fed’s money ended up as deposits in banks.
3) The Fed wanted to ensure that the deposits created by QE were not multiplied via the creation of new loans as is almost always the case with new deposits. They worried that such an occurrence would have inflationary consequences. (For more information on how banks use deposits to create money we recommend watching this short video on the fractional reserve banking system) To incentivize banks to hold the new deposits as excess reserves, the Fed paid banks interest on excess reserves, formally known as IOER.
Banks are required to hold a portion of each deposit as reserves to ensure that there is sufficient liquidity should a large number of depositors wish to withdraw their money simultaneously. Any reserves above the Fed’s requirements are considered excess reserves. Prior to QE, banks maximized their deposit base and therefore loan potential by holding near zero excess reserves as shown in the chart below.
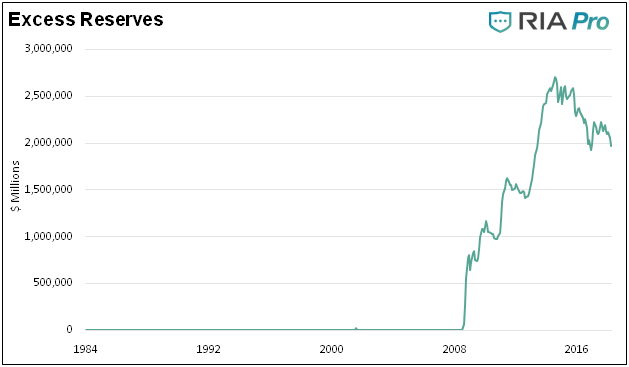
Data Courtesy St. Louis Federal Reserve (FRED)
Based on the sequence of events, many believe the Fed simply conducted an asset swap in which they swapped bonds for excess reserves. So, while the Fed certainly printed money to buy the bonds, one can conclude that if QE resulted in a 1 for 1 increase in excess reserves, an asset swap ultimately occurred. The following graphs help us better define the outcomes of QE. The first graph charts the changes in the Fed’s balance sheet (i.e., QE) and the changes in excess reserves.
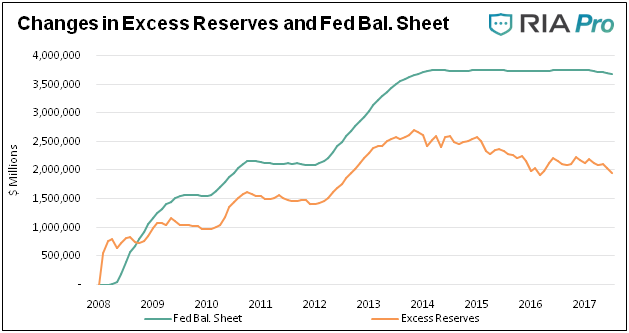
Data Courtesy St. Louis Federal Reserve (FRED)
Clearly, some of the Fed’s money used to buy bonds ended up in excess reserve accounts as the Fed wished. However, and this is extremely noteworthy, the chart below shows the aggregate amount of QE that did not end up as excess bank reserves. This is the difference between the green line and the orange line in the chart above. This portion of QE ended up in the financial markets and ultimately was used to create new loans. By any definition, this is new money and helps answer our lead question.
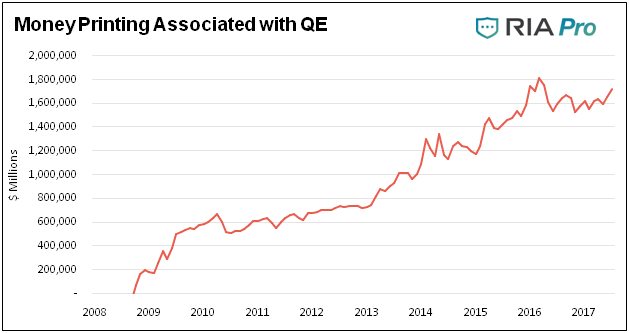
Data Courtesy St. Louis Federal Reserve (FRED)
Now, let’s reconsider the interest (IOER) the Fed paid banks to persuade them not to lend the money. From a bank’s perspective, the incentive to hold the money was purely financial. Given the weakened capital positions of banks in the post-crisis era, they could earn risk-free profits and bolster their capital as long as the IOER was greater than the rate they paid on deposits. The following graph shows the average of the Fed’s aggregated data on jumbo (>$100k) deposit rates and three-month CD rates as compared to the IOER rate.
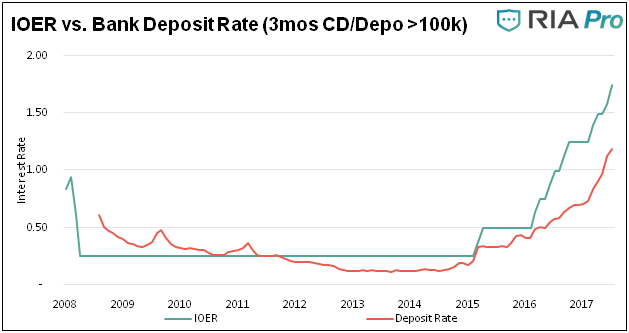
Data Courtesy St. Louis Federal Reserve (FRED)
The deposit rate calculation used in the graph is likely very generous. Accordingly, banks’ profits as displayed and discussed below is likely much greater. The table below shows the average national jumbo deposit rates for a host of deposit products as published by the FDIC. As a point of reference the current IOER rate is 1.75.
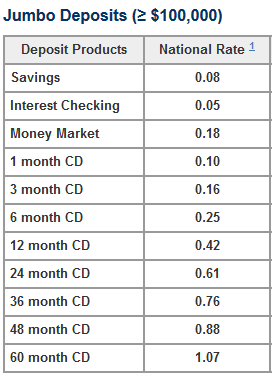
Data Source FDIC
Over the course of the QE experiment, excess reserves generated significant profits for the banks. Please remember, these profits are risk free and essentially gifted to banks by the Fed. Further, these profits were reinvested in most cases on a leveraged basis into the financial markets. While we do not know how much leverage was employed, it is safe to assume it was at least 10x.In other words, every dollar earned by banks accepting low interest deposits and converting those to higher-interest paying and risk-free excess reserves resulted in ten dollars’ worth of new investments. This further supported asset prices.
To summarize QE, the Fed purchased bonds which helped asset prices initially stabilize and over time drive them higher. Through higher asset prices, lower borrowing rates and IOER profits, the banks were recapitalized. The supply of bonds in the financial markets was reducedand interest rates were lower as a result. Economic activity benefited from lower interest rates and healthier banks.
One might be tempted at this point to use the infamous George Bush quote “mission accomplished.”
Not so Fast - QT
Regardless of whether you agree with us that QE was money creation or still think it was an asset swap,QE must appear to be a win-win. Unfortunately, this monetary panacea is being reversed in efforts to tighten monetary policy and stave off inflationary concerns.
The following bullet points highlight how quantitative tightening (QT) will likely affect the financial markets and economy:
- Asset Prices - QE removed $3.5 trillion in bonds from the marketplace, which had a ripple effect on equities, bonds, real-estate and a host ofunconventional assets such as art, cars and wine. Many of these assets rose significantly during the QE era despite economic fundamentals that were not supportive of such price increases. Equity valuations, by many measures, now stand above levels that preceded the Great Depression and are not far from those of 1999. It is pretty clear that QE and asset prices are joined at the hip. If that is the case, shouldn’t we prepare ourselves for lower asset prices as the Fed reverses the effects of QE?
- Banks Capital Positions - According to most banking analysts, banks now have healthy levels of capital and are in a much better position to withstand a 2008 type of crisis. While we have little reason to doubt the analysts, we do wonder if the banks are prepared for an environment in which interest rates rise amid falling asset prices. Keep in mind, the collateral behind many loans are linked to financial asset prices.
- Lower Interest Rates - Interest rates are lower than they otherwise would have been. Per the Fed’s guidance “Our model suggests that the cumulative effect of the Federal Reserve’s asset purchases results in a reduction in the 10-year Treasury yield term premium of about 100 basis points (1.00%).” (Source Fed Notes) As such, it is hard to come up with a reason why we should not expect higher rates. When one of the major holders of U.S. Treasuries and MBS initiates a well-publicized initiative of reducing their position substantially, higher yields on those securities should result.
- Economic Growth - Given that $1.7 trillion was printed and not held as excess reserves and that money was then multiplied, the associated loan growth certainly fueled economic activity. The effect is impossible to quantify, but it is certainly positive. When the Fed reduces their balance sheet, any reduction that does not affect the level of excess reserves should have a negative economic effect as it is a withdrawal from loan provision or other acts that have positive effects on the economy. Recently, this has not been the case as excess reserves have declined at a much quicker pace than the Fed’s balance sheet.
Summary
The evidence is clear that QE was designed to recapitalize the U.S. financial system via higher asset prices. Not only did it serve this purpose but it provided banks with risk-free profits from IOER which was leveraged to increase profits and further build capital. The Fed denies this and claims its primary goal was to encourage economic growth for the benefit of all Americans. Had this truly been the case, they would not have introduced IOER and provided incentive for banks to not lend money
Regardless of your views, the Fed did accomplish something, but at what cost? In the wake of QE, lower interest rates have encouraged even more debt and asset prices that, in many cases, are well above reasonable valuations. Said differently, they re-inflated the bubble instead of allowing the free markets and a normal economic cycle to cleanse the excesses of prior years.
Given that economic growth is largely dependent on debt growth and the debt, in many instances, is backed by overvalued assets, what happens as the Fed reverses course and asset prices revert to their historical norms? We must further consider how the broad economy will withstand higher interest rates, especially if economic growth remains at current levels or declines.
The Fed is reversing course. Are you fully prepared for this?
For more information about our services, please visit us at www.realinvestmentadvice.com or contact us at 301.466.1204 or email mplebow@720global.com
Michael Lebowitz, CFA is an Investment Analyst and Portfolio Manager for Clarity Financial, LLC specializing in macroeconomic research, valuations, asset allocation, and risk management. Michael has over 25 years of financial markets experience. In this time he has managed $50 billion+ institutional portfolios as well as sub $1 million individual portfolios. Michael is a partner at Real Investment Advice and RIA Pro Contributing Editor and Research Director. Co-founder of 720 Global. You can follow Michael on Twitter.


There are no comments to display.
Create an account or sign in to comment
You need to be a member in order to leave a comment
Create an account
Sign up for a new account. It's easy and free!
Register a new account
Sign in
Already have an account? Sign in here.
Sign In Now