
You may be familiar with IVR and IVP, as they’ve become relatively commonplace since we started offering them, but let us review them nonetheless. IVR is the Implied Volatility Rank. It uses the IV over the past year as a baseline from which it ranks the current IV. Sound complicated? It isn’t—let’s illustrate this with an example:
Assuming volatility hit its high at 135 and its low at 33, and the current volatility is 76, we do the following calculation:
(76-33)/(135-33)*100=42.16%
The formula for this is: (current IV – low IV)/(high IV – low IV) * 100 = IVR
In the above example, the IVR is just below the middle of its 52 week range. Since regression to the mean is the fundamental concept, the first task is to estimate the mean. Volatility charts are useful to help determine an estimate for the mean considering it can change dramatically after events such as an announced take over or FDA announcement creating a new "relevant range."
Typically, an IVR over 50% suggests rising implied volatility often seem before earnings announcements when it advances into the report date and then begins declining back toward the mean. This could be good news for volatility strategists to be long options into the report date and then reverse their position anticipating declining implied volatility after the report. In general, a low IVR suggests implied volatility is likely to rise back toward the mean while a high IVR suggests that it is likely to decline.
IVP is the Implied Volatility Percentile—indicating how often implied volatility was lower than its current level. For example, an IVP of 90 suggests that implied volatility was lower 90% of the time over the past year.
To highlight the difference between these two measures, while the IVR may only be 40%, thus suggesting the current IV is in the lower part of its range, the IVP may be 90, suggesting that 90% of the time, the IV was lower. Here, the IVR indicates that the current IV is relatively low compared to its high, and options could be considered relatively inexpensive. Yet, considering an IVP of 90, we knowthe high IV was an outlier, and most of the time, the IV was lower than the current level, signaling that options are actually relatively expensive. Using only IVP helps resolve this issue, but IVR can still show exactly the current position in the range.
A rough and ready interpretation of IVP is when considering buying options, look for a low IVP, but when considering selling options, look for a high IVP. This way, you can profit off the price of volatility, rather than pay it.
High implied volatility relative to the past implied volatility, usually found before events such as earnings reports or FDA announcements, indicates increased options prices in expectation of a large move in the underlying. While the actual move may not be as severe as suggested by the implied volatility, on occasion it may be even greater resulting in what could be a substantial loss for an option position that is short on one side. One way to mitigate this risk is to be short both sides by using an Iron Condor or perhaps an Iron Butterfly. Another alternative is to go with the flow and accept the possibility that the underlying could move even more than suggested by the implied volatility. Calendar spreads, short the near-term option while long the deferred, may also be considered, but with short gamma, or rate of change of delta, a large move in the underlying will results in a loss.
Let’s look at an example:
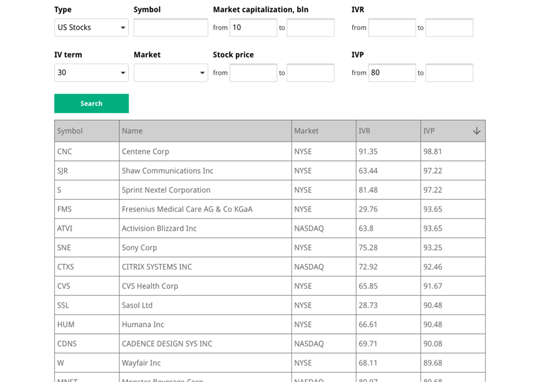
In this example the minimum Market Cap was set at of $10B. This may not be necessary since the Advanced Ranker filters out any symbols with inconclusive or difficult to calculate IV data. Next for IVP the minimum was set at 80 and sorted by descending IVP. Typically, a high IVP suggests an increased the risk of a large move in the underlying. In the top category are CNC, STR, S, etc. A quick google search reveals these companies are planning earnings reports in the next few weeks. The high IVP’s are earnings report related and since they will not report for a few weeks the IVP could increase even more. In fact, the first 8 results are planning to release earnings in the next few weeks (who doesn’t love earnings seasons).
For SSL the earnings call isn’t until June. Of course, this requires more investigation, but at onset, it seems like a prime candidate for a long volatility strategy into the earnings report date. IVR shows implied volatility has been over three times its current value, but very infrequently. This suggests implied volatility will likely decline. Here, an astute trader could gain from the higher implied volatility using short puts. Of course, it's necessary to understand the risks associated with selling puts.
An alternative use for the Advanced Ranker is to just use it to search for an underlying when seeking volatility strategies since the Advanced Ranker can help to determine if-and-when options on that underlying are over- or under- priced.
Related articles:
- IVolatility Tools: Probability Calculator
- IVolatility Tools: Advanced Options
- IVolatility Tools: PnL Calculator


There are no comments to display.
Create an account or sign in to comment
You need to be a member in order to leave a comment
Create an account
Sign up for a new account. It's easy and free!
Register a new account
Sign in
Already have an account? Sign in here.
Sign In Now