
In the first 18 trading days of 2018, the S&P 500 set 14 record highs and amassed a generous 7.50% return for the year.
As quoted, CNBC and most other financial media outlets were exuberant over the prospects for further gains. Wall Street analysts fell right in line. Despite the fact it was not even February, some Wall Street banks were furiously revising their year-end S&P 500 forecasts higher.
On January 27th, the S&P 500 closed down 0.70%, and in less than three weeks, the index fell over 10% from the January 26th high. Very few investors harbored any concern that the rare down day on the 27th was the first in a string of losses that would more than erase 2018’s gains to that point.
Looking back at the January swoon, there were a few indicators that CNBC, others in the media, and those on Wall Street failed to notice. In mid-January, we noticed an anomaly which proved to be a strong leading indicator of what was ultimately to transpire.The purpose of this article is tore-introduce you to this indicator,as it may once again prove helpful. We’ll also remind you why ignoring media and Wall Street driven hype is important.
VIX
VIX is the abbreviation for the Chicago Board of Options Exchange (CBOE) Volatility Index, which gauges the amount of implied volatility in the S&P 500 as measured by pricing in the equity options market.
When optimism runs high, investors tend toseek less downsideprotection and as such VIX tends to decline. Conversely, when markets are more fearful of the downside, VIX tends to rise as investors are willing to pay higher prices for protection via the options market. While not a hard and fast rule, VIX tends to be elevated in down markets and subdued in bullish markets. This historical relationship is shown below. The beigerectangleshighlight recent market drawdowns and the accompanying VIX spikes.
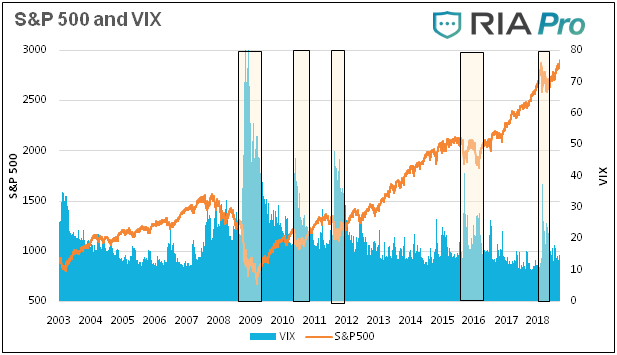
Data Courtesy Bloomberg
Another way to show the relationship is with a scatter plot. Each dot in the plot below represents the percentage change in VIX and the associated percentage change in the S&P 500 for the prior 20 days. The data goes back to 2003. While there are outliers, the graph generally illustrates an inverse relationship, whereby a higher VIX is associated with lower S&P returns and vice versa.
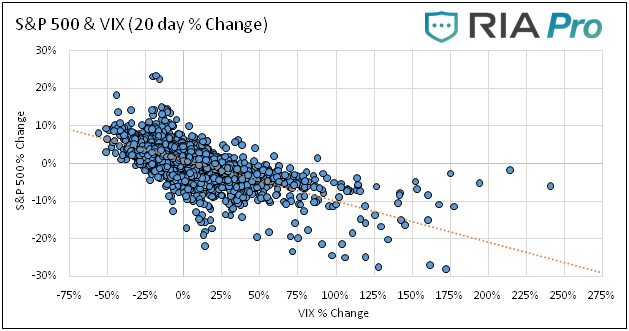
Data Courtesy Bloomberg
January 10th-26th
With an understanding of volatility and its general relationship with marketdirection, we return to the 12 trading days leading up January 27th. The graph below charts the VIX index and the S&P 500 from January 1st to the 26th.
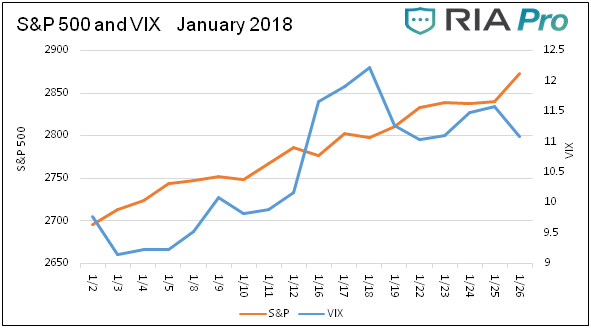
Data Courtesy Bloomberg
The obvious takeaway is that the VIX and the S&P rose in unison. Despite a euphoric financial media, daily record highs and a strong upward trend,investors were increasingly demanding insurance in the options markets.
The scatter plot and its trend lines below show this divergence from the norm.The orange dots represent the daily VIX and S&P changes from the 10th to the 26th while the blue dots represent every trading day from January 1, 2017, thru August 2018.
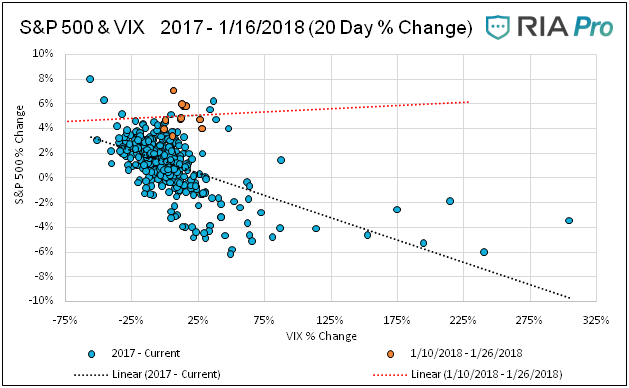
Data Courtesy Bloomberg
From January 27, 2018 to early March, the VIX was trading over 20, twice the general level that prevailed in early January and throughout most of 2017. The elevated VIX and weak market resulted in a normalization of the typical inverse relationship between volatility and equity performance,and it has stayed normal ever since. The green dots and green trend line in the graph below represent data since January 27th. The divergence and normalization can best seen by comparing the trend lines of each respective period.
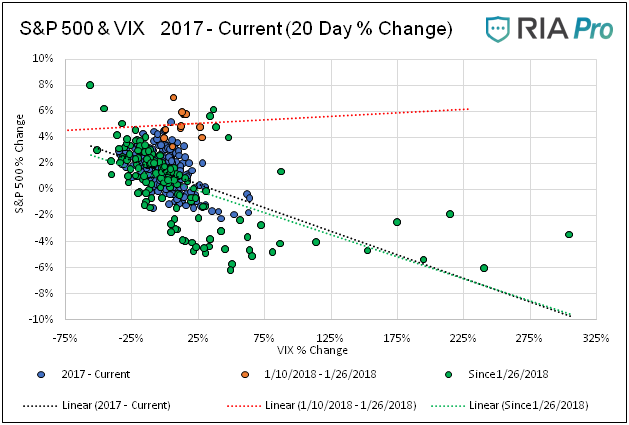
Data Courtesy Bloomberg
Tracking VIX
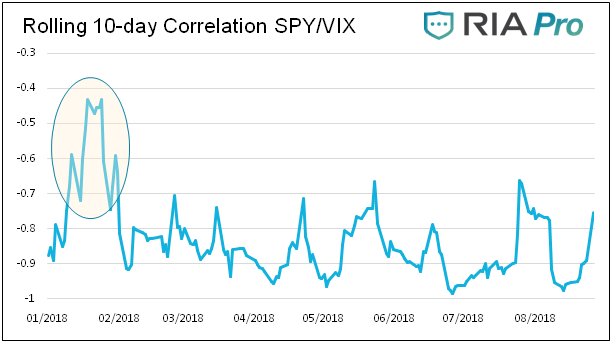
In addition to identifying the relationship as we did in January, we must monitor this relationship going forward. We show two additional metrics for VIX and S&P 500 below that we created to alert us if the typical inverse relationship changes.
- Running Correlation: Calculates the correlation between the VIX and the S&P 500 on a rolling 10-day basis. The highlighted area on the line graph below shows the departure from the norm that occurred in mid-January.
-
Anomaly Count: Counts the number of days in a period in which the S&P was higher by a certain percentage and the VIX rose. In the second chart below,the blue bars represent the number of trading days out of the past 20 days when the S&P 500 rose by more than .50% and the VIX was higher.
Data Courtesy Bloomberg
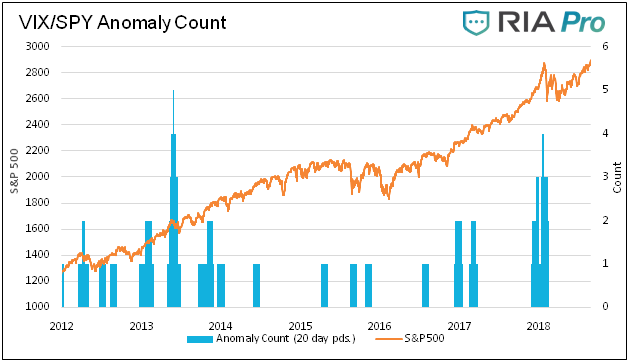
Data Courtesy Bloomberg
Summary
Markets do not suddenly drop without providing hints. As we discussed in our article 1987, the devastating Black Monday 22.60% rout was preceded by many clues that investors were unaware of or, more likely, simply chose to ignore.
Currently, most technical indicators are flashing bullish signals. Conversely, most measures of valuation point to the risk of a major drawdown. This stark contrast demands our attention and vigilance in looking for any data that can provide further guidance. The VIX is just one of many technical tools investors can use to look for signals. We have little doubt that, when this bull market finally succumbs to overvaluation and the burden of imposing levels of debt, clues will emerge that will help us anticipate those changes and manage risk appropriately.
Michael Lebowitz, CFA is an Investment Analyst and Portfolio Manager for Clarity Financial, LLC specializing in macroeconomic research, valuations, asset allocation, and risk management. Michael has over 25 years of financial markets experience. In this time he has managed $50 billion+ institutional portfolios as well as sub $1 million individual portfolios. Michael is a partner at Real Investment Advice and RIA Pro Contributing Editor and Research Director. Co-founder of 720 Global. You can follow Michael on Twitter. This article is used here with permission and originally appeared here.
Related articles:


There are no comments to display.
Create an account or sign in to comment
You need to be a member in order to leave a comment
Create an account
Sign up for a new account. It's easy and free!
Register a new account
Sign in
Already have an account? Sign in here.
Sign In Now