
First it is important to understand what is the goal of the Anchor trades: it is to prevent loss of capital while still generating a positive return in all market conditions. It is NOT to outperform the market.
One of the most important parts of evaluating a strategy is to appropriately set target returns and develop a good benchmark to measure relative performance. Without a known target, measuring performance internally is difficult. Without an appropriate benchmark, measuring against the competition is impossible. In order to do this, we need to break the Anchor strategy down into its key components for evaluation. Anchor is comprised of:
- A long ETF position that is typically 88%-92% of the total investment;
- A long put position that is typically 7%-10% of the investment for the hedge; and
- A short put position that makes up the balance to attempt to pay for the hedge.
When Anchor was originally devised our goal was to slightly lag the markets in up years, stay level in flat market returns, and beat the market significantly in down years. That worked in years the market was up ten percent or less, which was the primary evaluation period. However, the past several years of bull markets have demonstrated that the term “slight lag” is not realistic or appropriate in large up markets.
Given the fact that Anchor is only approximately 90% long at any given time, we automatically are behind bull market performance. For example, if the market goes up 20%, Anchor’s long ETF positions may only go up around 18%. Couple that with the fact that in significant up trending markets, the long hedge rolls multiple times per year and you end up with larger lags in rising markets – which get more pronounced the faster the market is rising. A more effective measurement would be to compare Anchor to a portfolio with comparable risk, such as a 60/40 stock/bond portfolio. However, even that is not an ideal metric, as Anchor's option hedge can significantly outperform it in bear markets, making comparisons difficult.
Swan Global Investment’s Defined Risk Strategy is quite similar to Anchor. Swan does a nice job of setting expectations on their website with a “Target Return Band” shown below:
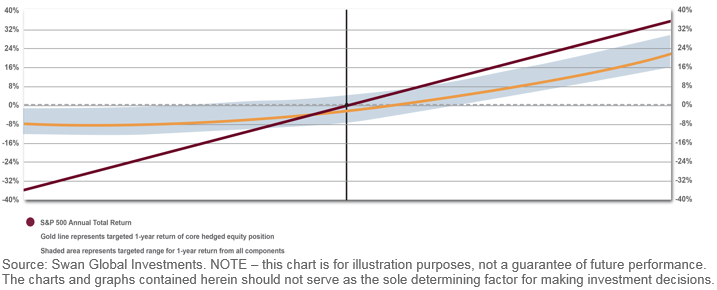
The theory being that their Defined Risk Strategy should fall within or above the blue range. The red line represents the theoretical return of the S&P 500, the yellow line is the Swan’s Defined Risk Return target returns when contrasted with the S&P 500 return at the point.
It is our opinion that these target bands represent an adequate projection of what results should be expected internally of the Anchor strategy as well. We will of course always work to exceed those expectations, but this will represent more realistic return projections for Anchor, particularly in large bull scenarios.
Another advantage to evaluating Swan’s Defined Risk Strategy, is it now gives us an appropriate benchmark to measure against. In describing their product, Swan states:
“Investing to help minimize downside risk. The market is unpredictable, making it difficult to time the markets or consistently pick outperforming stocks. That’s why we believe reducing downside risk can significantly impact wealth creation.”
“The goal: to achieve positive returns while minimizing the downside risk of the equities markets.”
“Key strategy elements to each of the Defined Risk Funds include:
- No reliance on market timing or stock selection
- Designed to seek consistent returns
- Aims to protect client assets during market downturns
- Always hedged, all the time, using put options”
“Repeatable Four Step Investment Process
Step 1: Establish Equities (using diverse ETFs)
Step 2: Create the Hedge – Always hedged – We use only longer term puts, which offer the greatest cost-efficiency and stability, and then maintain that protection by rolling the hedge at least annually. As such, the DRS (Swan’s Defined Risk Strategy) is not under duress to seek protection in market downturns.
Step 3: Seek to Generate Market-Neutral Cash Flow – We use options-trading expertise to provide our clients with the potential for return, regardless of market conditions.
Step 4: Monitor and Adjust”
To anyone who has used Anchor, this should all sound familiar. Since Swan’s impressive track record is significantly longer (going back to 1997 in different forms) than Anchor it provides proof of concept. Swan’s Class I mutual fund shares have returned the following (courtesy Morningstar) since 2013:
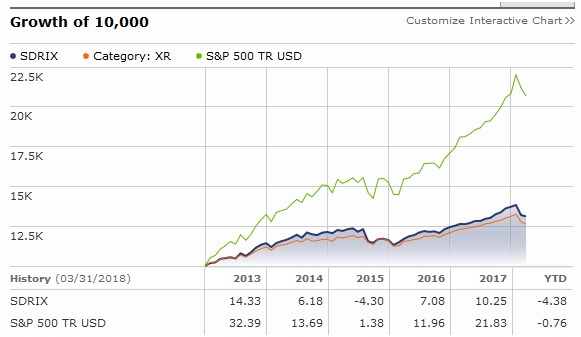
Vs Anchor:
Disclosure: Anchor's returns have not been audited by any independent third party, do not guarantee future results, and do not reflect the deduction of applicable management and/or subscription fees. Anchor’s 2013 returns were dramatically increased by the use of individual stocks which outperformed the market, as opposed to the broad market ETFs that are now used within the strategy to reduce tracking error.
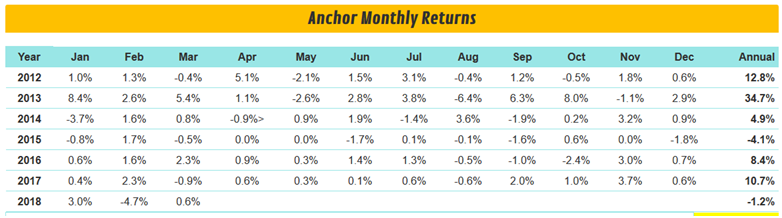
The following table compares Anchor returns with S&P 500 total return, expected return (as defined by Target Return Band) and Swan returns. Anchor outperformed the Swan every single year except 2014.
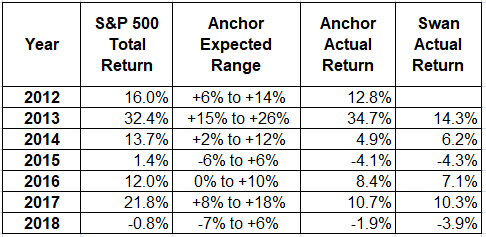
While some investors may be frustrated that Anchor lagged the bull market in 2016 and 2017, we believe that is not so much a design flaw in Anchor, as a flaw we made in setting proper expectations.
Conclusion:
The Anchor objective is to produce equity like returns over a full market cycle, with reduced volatility and bear market drawdowns. Investors should expect a trade-off of reduced upside capture during extreme bull market gains. Given our belief that the long term is the only investment time frame that truly matters, we believe the strategy provides attractive mathematical and psychological benefits to investors seeking the long term growth potential of the US stock market.
If you have any questions about the Anchor Strategy, how to implement it on your own, or wish to have us manage the strategy for you, contact my firm at anytime or make a post on the SteadyOptions website:
Lorintine Capital
Christopher Welsh: cwelsh@lorintine.com
Jesse Blom: jblom@lorintine.com
P: 214-800-5164
F: 214-800-5165


There are no comments to display.
Create an account or sign in to comment
You need to be a member in order to leave a comment
Create an account
Sign up for a new account. It's easy and free!
Register a new account
Sign in
Already have an account? Sign in here.
Sign In Now